|
<< Click to Display Table of Contents >> PRT |
  
|
|
<< Click to Display Table of Contents >> PRT |
|
The PRT statement prints variables/expressions (synonyms: P, PRI or PRINT), optionally using so-called operators like d, p, m, q, etc. For timeseries, mixed frequencies and array-series are supported, but PRT can be used to print any variable type, including scalars, lists and matrices. PRT has a close cousin DISP, the difference being that DISP can show more meta information like labels, dimensionality, data-traces, modeling info, etc. Note that PLOT, SHEET and CLIP have the same syntax, so you can always change PRT into PLOT/SHEET/CLIP.
Guide: printing For an easier introductory guide on Gekko printing, see this page. |
Per default, a statement like prt x1, x2; shows the timeseries x1 and x2 in columns, but beware that lists of names like x{#i} , wildcards like {'x*'} or array-series will auto-unfold into the colmns, and in addition, you may use multiple print operators, for instance <n d p> to get three columns with both levels, absolute time-differences and percentage growth (default is <n p>, that is, levels and percentage growth). For an array-series x, prt x; will print out all its elements (sub-series), but the sub-series can also be unfolded by means of lists, for instance prt x[#i,#j]; or a single sub-series: prt x[a,b];. The output can be formatted, for instance transposing the output with <rows> or setting field width, decimals etc.
Note that a bankless variable x in prt x; may be searched for in other databanks than the first-position databank, cf. the databank search page. Use for instance b1:x; to make sure x is from the b1 databank, and use @x (or ref:x) to access x from the Ref databank. You may also use <bank=...> to designate the databank (<ref=...> to designate the Ref (reference) databank).
As mentioned, PRT supports mixed frequencies, for instance annual and quarterly data in the same print, like prt x!a, x!q;. PRT can auto-collapse (aggregate) higher frequencies if needed, so that collapsed values are shown, too.
Some additional details:
•For list printing, there is a special prt<view> option, which is useful for scrolling through larger (nested) lists of strings.
•The MULPRT statement is very similar to PRT, but compares data in the first-position and Ref (reference) databanks. You may just use prt<m> or prt<q> to achieve the same thing.
•After any PRT of timeseries, you may click the Copy-button in the main window to copy-paste the print to Excel or other spreadsheets (CLIP will do the same thing, else see SHEET).
prt < period operators I=... decimals width ROWS FILTER=... COLLAPSE=... NOMAX BANK=... REF=... SPLIT MISSING=... LABEL=... VIEW > elements FILE=filename;
•If no period is given inside the <...> angle brackets, the global period is used (cf. TIME).
•If a variable without databank indication is not found in the first-position databank, Gekko will look for it in other open databanks if databank search is active (cf. MODE).
where: |
|
period |
(Optional). Local period, for instance 2010 2020, 2010q1 2020q4 or %per1 %per2+1. |
operators |
operator operator ... |
operator |
n, d, p, dp, m, q, mp, l, dl, r, rd, rp, rdp, rl, rdl, a, an, ad, ap, adp, al, adl, v, i. (There are also less-used 'long' operators: abs, dif, pch, gdif). |
decimals |
DEC=number | NDEC=number | PDEC=number |
width |
WIDTH=number | NWIDTH=number | PWIDTH=number |
elements |
element element ... |
element |
variable label < operators decimals width > |
details: |
|
operators |
(See details in examples section). Use d, p and dp for time-transformations, and m, q and mp for multiplier-transformations. Prefix the time-transformations with r for reference values, or a for both first-position and reference values. You may use i or i=... for index=100 in the starting or chosen period. See also option print prt ....
'Long' operators: abs, dif, pch or gdif. These can be switched off by means of prefix no (for instance nopch), or added to existing default operators by means of underscore (for instance _dif). Default operators are abs and pch (absolute level and percentage growth is printed). |
element |
The variable can be a variable name, a list of names (for instance {#m}), or an expression. A label can be provided after the variable (must be a string, and will be ignored for lists). Operators here will override other operators (globals ones, or those set on the PRT statement), so element-operators are local to the particular element. You may use for instance prt x x.fromseries('label'); to use label metadata, otherwise see the <label> and <meta...> options. |
I |
Index each print element, similar to the REBASE statement or rebase() function. For instance, prt <i> x1, x2; will index x1 and x2 to be 100 at the start of the period, whereas prt <i=2020q1> x1, x2; will index x1 and x2 in the period 2020q1. If you need to combine <i> with the print operators, use for instance <i d> to show time differences (and not <id>). Note that the indexing operation is performed before any print operator, as if REBASE or rebase() had been performed beforehand.
Beware that while for instance <i p> is always equal to <p>, the multiplier version <i q> is not equal to <q>, because <i q> will always be = 0 at the index date. |
YOY |
Year-on-year: with this option, operators like d (time-differences) or p (percentage growth) use 4 lags for quarterly and 12 lags for monthly series. So for instance, for a quarterly series x!q, the statement prt <yoy p> x!q; shows the year-on-year growth rate (x/x[-4]-1)*100 rather than the normal quarterly growth rate (x/x[-1]-1)*100. Note: if <yoy> is used without a difference operator like for instance d or p, it is implicitly understood as <yoy p> (year-on-year percentage growth). |
DEC |
Sets number of decimals, will apply to all kinds of numbers. |
NDEC |
Sets number of decimals for non-percentage numbers. See also option print fields ndec.... |
PDEC |
Sets number of decimals for percentage numbers. See also "option print fields pdec... |
WIDTH |
Sets width, will apply to all kinds of numbers. |
NWIDTH |
Sets width for non-percentage numbers. See also option print fields nwidth.... |
PWIDTH |
Sets width for percentage numbers. See also option print fields pwidth.... |
ROWS |
If set, the result will be transposed, i.e., with variables running downwards. Corresponds to TRANSPOSE=yes for SHEET and CLIP. |
FILTER |
A timefilter can be activated or deactivated (see TIMEFILTER statement). With <filter> or <filter=yes>, the current timefilter is used. With <nofilter> or <filter=no>, any filtering is deactivated. The filter type can also be changed locally, for instance <filter=hide> hides the out-filtered periods, whereas <filter=avg> averages the out-filtered periods. See option timefilter.... |
COLLAPSE |
(Optional). This option will collapse quarterly or monthly data into annual averages or totals. Use prt<collapse>, prt<collapse=avg> or prt<collapse=total>. You may set the collapse globally, cf. option print collapse = [avg|total|none];. Only applies for option print freq = pretty; (which is default). |
NOMAX |
(Optional). Do not restrict the number of variables, cf. option print elements max. |
BANK |
(Optional). A bankname where variables are looked up. For instance prt <bank = b1> x; is equivalent to prt b1:x;. See also <REF = ...>. These options can be convenient instead of opening and closing banks. |
REF |
(Optional). A bankname where reference variables are looked up. For instance prt <bank = b1 ref = b2 m> x; uses banks b1 and b2 for the multiplier. See also <BANK = ...>. These options can be convenient instead of opening and closing banks. |
SPLIT |
(Optional). If set, the variables or expressions delimited by comma are shown separately. In this way, prt x, y; is shown as if it had been prt x; prt y;. This may be practical for comparisons of data with similar columns, for instance prt <split> x[#i], @x[#i];. In that case, you may prefer to use for instance the <missing = m> option, so that all columns (#i) are shown (and are hence aligned), regardless of whether the sub-series exist or not. |
MISSING= |
(Optional). With <missing = ignore>, PRT will deal with missing array sub-series and missing data values like GAMS, treating them as zero for sums and mathematical expressions, or skipping the printing of a sub-series if it does not exist. The following options are set locally and reverted afterwards: option series array print missing = skip; option series array calc missing = zero; option series data missing = zero. An analogous <missing=ignore> option can also be used for SERIES, PLOT, SHEET, CLIP, and DECOMP. See also the appendix page on missings. |
LABEL |
(Optional). <label> is the same as <meta=l>, showing labels. See the <meta> option. |
META= |
(Optional). With <meta=...>, Gekko can show series meta information instead of series names. You can choose between n (name), l (label), s (source), u (unit), and p (stamp), for instance <meta=ls> to show label and source, or <meta=ln> to show label and name.
<meta=...> will work for lists of names like prt <meta=ls> {#m};. Using for instance prt <meta=l> x; is easier than the more cumbersome prt x x.fromseries('label');. Remember that labels from an external file or model file can be loaded with doc<varlist>). |
VIEW |
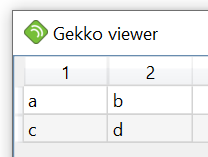
(Optional). Used for nested lists. With this option, Gekko starts up a graphical viewer, which is primarily (at the moment) intended for viewing nested lists. For instance, a list like #m = (('a', 'b'), ('c', 'd')); would look like the following with prt <view> #m;:
In the longer run, views of series/array-series etc. may be implemented, too. The viewer handles convenient scrolling of large lists, and supports sorting etc. |
FILE |
(Optional). A filename that the print is put into. Filenames may contain an absolute path like c:\projects\gekko\bank.gbk, or a relative path \gekko\bank.gbk. Filenames containing blanks and special characters should be put inside quotes. Regarding reading of files, files in libraries can be referred to with colon (for instance lib1:bank.gbk), and "zip paths" are allowed too (for instance c:\projects\data.zip\bank.gbk). See more on filenames here. |
There are the following operators (the @ below indicates values taken from the Ref (reference) databank):
'Short' operators for PRT
n |
Absolute level: x. Equivalent to no use of operators. |
d |
Absolute time change: x-x[-1] |
p |
Growth rate: (x/x[-1] -1)*100 |
dp |
Change in growth rate: (x/x[-1] -1)*100 - (x[-1]/x[-2] -1)*100 |
m |
Absolute multiplier: x-@x |
q |
Relative multiplier: (x/@x-1)*100 |
mp |
Multiplier in growth rate: (x/x[-1] -1)*100 - (@x/@x[-1] -1)*100 |
l |
Log: log(x). |
dl |
Log-difference: log(x)-log(x[-1]). |
r |
Absolute level in Ref (reference) databank: @x. Code 'rn' is equivalent. |
rd |
Absolute time change in the Ref (reference) databank: x-x[-1] |
rp |
Growth rate in Ref (reference) databank: (@x/@x[-1] -1)*100 |
rdp |
Change in growth rate in Ref (reference) databank: (@x/@x[-1] -1)*100 - (@x[-1]/@x[-2] -1)*100 |
rl |
Log: log(@x) |
rdl |
Log-difference: log(@x)-log(@x[-1]) |
a |
n + r (showing both, including percentage growth) |
an |
n + r (showing both, no percentage growth) |
ad |
d + rd (showing both) |
ap |
p + rp (showing both) |
adp |
dp + rdp (showing both) |
al |
l + rl (showing both) |
adl |
dl + rdl (showing both) |
v |
This is interpreted as 'verbose', |
i i=... |
Proportionally adjust the series to become 100 in the starting period (using <i>) or a chosen period like 2000 (using <i=2000>): x/x[indexperiod]*100 or @x/@x[indexperiod]*100. Correspondence: note that for instance prt <i=2000> x; yields the same result as prt x.rebase(2000);, cf. REBASE. |
There is the following logic to the above operators. The important operators to remember are d for absolute time change, p for percent time change, m for absolute multiplier, and q for relative multiplier. Then the combination dp is easily read as time change in growth rate, and mp as multiplier difference in growth rate. Log-transformations are done with l or dl operators. This covers the first and second sections of the above table. The third section is just the first section with prefix r (for Ref (reference) databank), and shows that same transformations as in the first section, just for the reference databank values instead of the first-position databank values. Of course, you can always write prt <p> @gdp; instead of prt <rp> gdp;, but for longer expressions and lists, the prefix r comes in handy.
In addition to the above transformations, the print can be formatted regarding the width of each data column, and the number of decimals. Width and decimals can be set in the PRT option field, or in element option fields. In the PRT option field, you may indicate the width and number of decimals like this: prt <width=10 dec=3>, or you may set absolute and percentage fields individually: prt <nwidth=10 ndec=0 pwidth=6 pdec=1>. This will yield absolute fields 10 characters wide with no decimals, and percentage fields 6 characters wide with 1 decimal. The width and decimals formatting can also be applied individually on each element, for instance prt gdp<n dec=0>, pgdp<p dec=1>, printing gdp in levels with no decimals, and pgdp as growth rate with 1 decimal.
The output can be transposed by means of the rows keyword, for instance prt <rows> gdp, pgdp;. This is handy for printing a long list of timeseries, or for copy-pasting the cells to a spreadsheet by means of the copy-button in the Gekko interface.
Finally, you can use a timefilter (see TIMEFILTER) in the PRT option field. This is convenient for suppressing individual observations when printing long time periods. See examples below.
Mixed frequencies
PRT can print out series of mixed frequencies in the same 'table' (frequencies a, q, m mixed, or frequencies m, d mixed), for example:
time 2001 2002; |
You may mix frequencies !a, !q and !m or !m and !d as you like, and mixed frequencies work for PLOT, too. Note that Gekko supports auto-collapse when printing, for instance prt <collapse=total> xx2!q; (this will print yearly totals).
A simple example (shows both levels and percentage growth):
time 2010 2012; // // x % real % // 2010 110.0000 M 107.8431 M // 2011 120.0000 9.09 115.3846 6.99 // 2012 110.0000 -8.33 103.7736 -10.06 // // x % x/p % // 2010 100.0000 M 100.0000 M // 2011 109.0909 9.09 106.9930 6.99 // 2012 100.0000 -8.33 96.2264 -10.06 |
M means missing value. The label for x/p in the first print is provided as a string after the expression. Please use a space to delimit variable and label. The <i> option is used to set index = 100 in the start of the period, which can be useful for variables with different scale (especially in plots: note that i is not an operator like d, p, m, etc, but an option).
Using operator p inside the option brackets would provide you with the growth rates alone:
prt <p> x, x/p; |
The print can alternatively be transposed with the <rows> option like this:
prt <p rows> x, x/p; |
You may mix variables, lists, expressions and operators as you wish (just separate the elements with commas):
time 2009 2012; |
Please note that the list #m is inside {}-curlies, because we are composing the variable names by putting a prefix x on each string element of #m.
Multiple operators can be used in one option field, as this example shows:
time 2011 2014; |
This corresponds to a hand-made version of the prt<v> statement, printing levels/growth in the first-position and Ref (reference) databanks in addition to the multiplier differences (absolute and relative). As you see, this PRT statement contains multiplier differences (codes m and q), so by means of using short operators you are free to mix multiplier values into the print.
Formatting can be applied in the following way:
prt <nwidth=10 ndec=0 pwidth=6 pdec=1> x; |
This prints out the absolute levels and percentage growth rates (this way of printing is default, see option print prt...), with width 10 and no decimals for the levels, and width 6 and 1 decimal for the growth rates. You may use formatting on each element, for instance:
prt x1, x2, x3<ndec=0 pdec=1>; |
In that case, only the last variable (x3) has a different number of decimals. Different databanks may be indicated:
prt x, @x, old:x, old:{#m}; |
This prints out the variable x from the first-position databank, x from the Ref (reference) databank (@-indicator), x from a databank with the name old, and variables corresponding to the list of strings #m, all taken from the old databank. Use OPEN to open a databank like old (note that you can use F2 to see the list of open databanks).
Wild-card lists (inside braces {...}) may be used instead of regular lists:
prt {'fx*2'}; |
This will print out all variables starting with fX and ending with 2 in the first-position databank (use ? as a single-character wildcard). In come statements, you may use for instance fx*2 directly as a wildcard instead of {'fx*2'}, but in PRT this would be ambiguous (fx*2 could be fx multiplied by 2).
To filter out the printing of individual periods, you may use a TIMEFILTER. For instance:
time 2003 2015; |
Looping over lists in combination with PRT is pretty straightforward. You may write:
time 2001 2003; |
This will print the series fxa, fxb, fya and fyb. If you are using Gekko interactively, you can obtain non-executing newlines by means of [Ctrl]+[Enter], and you execute the block of statements by means of marking the block before pressing [Enter]. Alternatively, and better, RUN the statements from a program file.
The example above can be done more easily like this (and will print as four columns):
//..continued |
Long operators
In addition to the 'short' operators like d, p, m, q, there are also some less-used 'long' operators available, if the user prefers these: abs, dif, pch and gdif:
'Long' operators for PRT
abs |
Absolute level: x |
dif |
Absolute time change: x-x[-1] |
pch |
Growth rate: (x/x[-1] -1)*100 |
gdif |
Change in growth rate: (x/x[-1] -1)*100 - (x[-1]/x[-2] -1)*100 |
Per default, PRT always prints out corresponding to prt<abs pch>, i.e., printing out the absolute level and the growth rate. These default options can be altered in option print prt ... (see 'Related options' below). For instance, to only print the level of a variable, use prt<abs>, to only print the growth rate, use prt<pch>, and to print absolute time change, use prt<dif>. You can alternatively switch off options with prefix no, for instance prt<nopch> (same as prt<abs>) etc. In addition, you can use the 'glue' prefix '_' to add options to existing options. For instance, prt<_dif> corresponds to prt<abs dif pch>, because dif is added to the default operators (abs and pch). You may put the codes after individual elements, for instance prt var1<pch> var2<dif>, to have var1 displayed as pch and var2 displayed as dif. Codes put on an element override more general codes put directly after PRT, so prt<pch> var1 var2<dif> yields the same result.
Note
If a model is loaded (see MODEL), the PRT statement indicates (E) for endogenous, and (X) for exogenous variables. Missing values are shown with a M instead of numbers. If some variable is missing in the databank (or the databank does not exist), an error message will be issued.
Note that prt <m> mybank:x; prints out the difference mybank:x - @x (and prt <r> mybank:x; prints out @x), where @x is x from the Ref (reference) databank. So when printing a multiplier involving a named (OPEN) databank, Gekko will look for the same variable in the Ref (reference) databank, in order to compute the multiplier.
You may change what is printed as default via the option print prt ... options (see 'Related options' below). For instance you may want to switch off printing of percentage growth permanently: option print prt pch = no.
Related options
option freq = a;
option missing = error;
option print collapse = none;
option print disp maxlines = 3;
option print disp model gams scalar = modern;
option print elements max = 400;
option print fields ndec = 4;
option print fields nwidth = 13;
option print fields pdec = 2;
option print fields pwidth = 8;
option print freq = pretty;
option print index date = start;
option print index value = 100.0;
option print mulprt abs = yes;
option print mulprt gdif = no;
option print mulprt lev = no;
option print mulprt pch = yes;
option print mulprt v = no;
option print prt abs = yes;
option print prt dif = no;
option print prt gdif = no;
option print prt pch = yes;
option print split = no;
option print width = 100;
option series array print missing = error;
option series normal print missing = error;
option timefilter = no;
option timefilter type = hide;
Related statements
CLIP, DECOMP, DISP, MULPRT, PLOT, SHEET, TELL