|
<< Click to Display Table of Contents >> Missings |
  
|
|
<< Click to Display Table of Contents >> Missings |
|
Gekko timeseries, including array-timeseries, can be represented via dimensions, where one of the dimensions is time. In order to understand the concepts, a practical example is used throughout this section. The data contains information on 4- and 5-year old children, counted at the beginning of August each year, cf. the following table:
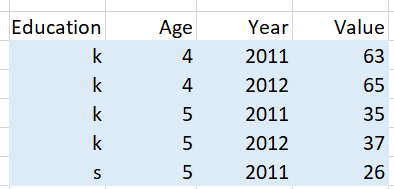
This table can be thought of as representing "rows" of data, or rows of multidimensional "observations" (in SQL, such a structure is called a "table"; in data science software it is called a "data frame"). The columns apart from the value (count of children) can be thought of as dimensions, in this case education (kindergarden or school), age, and year. Another way of visualizing at the table could be this (for each of the two years):
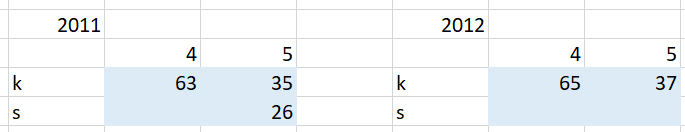
As it can be seen, there are no data corresponding to 4-year old schoolchildren (they do not go to school), and regarding 5-year old schoolchildren in 2012, the value seems to be missing. This may be because the data was accidentally not updated, but if not, we would have preferred an explicit value 0 for this combination (in GAMS: the special value eps, more about this later on).
In Gekko, the data could be represented as the following timeseries:
reset; time 2011 2012;
#e = k, s;
#a = ('4', '5');
x = series(2); //2 dimensions
x[k, 4] = 63, 65;
x[k, 5] = 35, 37;
x[s, 5] = 26, m(); //m() = missing
prt <n> x;
x[k, 4] x[k, 5] x[s, 5]
2011 63.0000 35.0000 26.0000
2012 65.0000 37.0000 M
Note that x is two-dimensional, since there are two dimensions apart from the time dimension. Note also that using prt <n> x[#e, #a]; would fail with an error (missing sub-series/element x[s, 4]). We will return to that question later on. Each column in the above print represents an array-subseries, where x is the array-series, and for instance x[k, 4] is an array-subseries belonging to x.
In GAMS, the same would look like this:
set e /k, s/;
set a /4, 5/;
set t /2011, 2012/;
parameter x(e, a, t);
x('k', '4', '2011') = 63;
x('k', '4', '2012') = 65;
x('k', '5', '2011') = 35;
x('k', '5', '2012') = 37;
x('s', '5', '2011') = 26;
display x;
2011 2012
k.4 63.000 65.000
k.5 35.000 37.000
s.5 26.000
Here, the x variable (defined as a parameter) is three-dimensional, since in GAMS, the time dimension is just a dimension among the other dimensions. The print looks similar, but it should be noted that whereas in Gekko the data is represented by three building blocks (the three array-series x[k, 4], x[k, 5], and x[s, 5]), in GAMS the data corresponds to the table rows, that is, seven building blocks, one for each value shown in the GAMS print (the combination s.5 in 2012 does not exist).
Missing series or missing data value?
From the Gekko and GAMS prints, it is seen that the data value x[s, 5][2012] is missing, whereas it is a bit less evident to see that the sub-series x[s, 4] does not exist at all.
As indicated above, GAMS does not make the distinction between missing series or missing data values. GAMS treats the elements of a variable x as simply rows of multidimensional data, where the time dimension is not special. In Gekko, the fact that there are no rows corresponding to the combination s, 4 entails that the array-series x does not contain any array-sub-series x[s, 4], so that particular sub-series is a missing series (does not exist inside x).
In contrast, regarding the data value x[s, 5][2012], the combination x[s, 5][2011] is present among the data rows, and therefore the sub-series x[s, 5] does exist (with missing value for the year 2012).
As it is seen, Gekko distinguishes between missing series and missing data values, and in many cases, this distinction can be practical. In the concrete case, if the data is supposed to have been updated for the period 2011-12, we would not expect an array-subseries to contain a missing data value like x[s, 5][2012]. It could be the case that there are no 5-year olds in school in 2012, for instance if the school is closing for new pupils. But in that case, it would have been sensible to add an explicit row with the value 0 to indicate that, instead of just skipping the row:
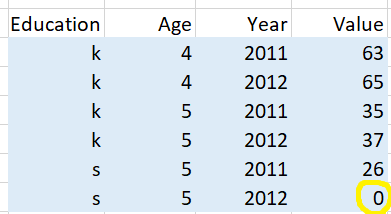
Because the default data value for a Gekko series is missing value, with an explicit 0, the user would know that someone actually set that value to 0 -- that is, updated it (in GAMS, the special value eps could be used to indicate a "real" updated 0). Setting such missing data values to 0 in Gekko does not put any burden on processor or memory. In contrast, creating an array-subseries x[s, 4] in Gekko and filling it with missing values (or 0's) would be a waste of processor and memory ressources. This particular combination (4-year olds in schools) simply does not exist, and should therefore not take up any memory space. Such cases where some sub-series are non-existing are very common, because data is often sparse in the non-time dimensions. For instance, "education" may span nursery, kindergarden, school, secondary education, etc., but for each of these, there is typically only a limited age range. For instance, storing array-subseries full of missing data values representing 10-year olds in kindergarden does not make much sense, and is certainly a waste of space.
There are many cases where a missing data value is always to be interpreted as missing in the sense of "needs to be updated" or "forgotten". An example could be a timeseries representing GDP, which simply does not make sense with the value 0. Another example is for instance the value of deliveries from one aggregate sector to another. If an array-subseries containing such data has data in 2011 and 2013, but a missing data value in 2012, this is probably an error. The nominal value of input-output deliveries between sectors do not normally change from non-zero to zero from year to year, so a missing value probably means that someone should update that value. Still, regarding deliveries between small sectors, such a value may become exactly 0 in some years, but representing this with a missing value should be considered bad practice. In that case, the user should by all means use a real zero to indicate that the data has been updated and is not just forgotten. All in all, the sparsity of data is often less prevalent in the time dimension than in other dimensions.
Missings, and three Gekko options
As noted above, Gekko distinguishes between missing series and missing data values, because this distinction is sometimes useful, for instance when summing up or printing array-series. When for instance summing up the nominal value of input-output deliveries between aggregated sectors, one of the deliveries may contain a missing value for, say, the year 2012. This may be unexpected, and as a consequence, the sum will contain a missing value for that year, too. In this way, a probable error can be identified and corrected, instead of just treating the value as if it had been 0. In contrast, when summing up data like this, a missing array-subseries is to be expected, because not all sectors deliver goods to all other sectors. So such a missing array-subseries can just be skipped (treated as 0), when summing up or printing, and therefore the distinction between missing series and missing data values can be useful.
To return to the kindergarden/school example, there is a missing array-subseries x[s, 4], corresponding to 4-year old schoolchildren. Such a series is absent, simply because there are no 4-year olds in the school classes. So in that sense, it is correct to treat x[s, 4] is implicitly containing 0's. In contrast, the missing data value x[s, 5][2012] is suspect. It could mean that the school has stopped admitting new 5-year old pupils in 2012, but is more probably an error (missing update).
In Gekko, there are the following options to control how missing series and missing data values are treated (default values are shown, too):
•option series array calc missing = error;
•option series array print missing = error;
•option series data missing = m;
1.The first option (calc) manages what happens if a whole array-subseries is missing, for instance in the expression x[s, 4] or sum((#e, x[#e, 4]), where #e contains the element s. The calc option deals with "controlled" indexes, that is, either a direct index like the s in x[s, 4], or a list index like x[#e, 4], where #e is controlled by for instance a sum-function.
2.The second option (print) manages "uncontrolled" indexing of array-subseries, for instance prt x[#e];, where #e is not "controlled" via for instance a sum function. In that case, the elements of x[#e] are unfolded into columns (instead of being summed), and the option controls what happens if some of the "uncontrolled" sub-series do not exist.
3.The third option (data) manages what happens if a series contains missing data values.
Regarding the first and second options: note that a statement like y = x[#e]; is not legal. Using list names as indexes in general assignments is only possible if the list is controlled in a sum-function, but in the PRT/PLOT statement, a statement likeprt x[#e]; with a free-floating (non-controlled) #e list is implicitly converted into prt unfold(#e, x[#e]); where the unfold()-function puts the elements into a list for subsequent printing/plotting as columns.
The following sections explains this in more details, with examples.
1. First option: calc missing
We will first take a look at option series array calc missing. This option deals with controlled sets/lists, for instance a sum like sum((#e, #a), x[#e, #a]), looping over the combinations of the sets/lists #e and #a. Consider the following, building upon the Gekko-code shown at the start of the section:
prt <n> sum((#e, #a), x[#e, #a]);
This will fail with an error, because the array-subseries x[s, 4] does not exist. With option series array calc missing = m;, Gekko can be asked to treat such an array-subseries as if it contained missing values instead, but in that case the sum will just be missing for each year. Instead, treating the missing sub-series as 0's does the trick:
option series array calc missing = zero;
prt <n> sum((#e, #a), x[#e, #a]);
sum((#e, #a
), x[#e, #a])
2011 124.0000
2012 M
Now there is at least a value in 2011, whereas the value in 2012 is missing, since x[s, 5][2012] has a missing data value. But the missing array-subseries x[s, 4] is ignored as expected.
2. Second option: print missing
Next, we will take a look at option series array print missing. As mentioned above, this option affects uncontrolled sets/lists,
prt <n> x[#e, #a];
This will abort with an error, because the array-subseries x[s, 4] does not exist. Now, you may try the following:
option series array print missing = m;
prt <n> x[#e, #a];
x[k, 4] x[s, 4] x[k, 5] x[s, 5]
2011 63.0000 N 35.0000 26.0000
2012 65.0000 N 37.0000 M
Here, the missing x[s, 4] is shown as missing data values (actually 'N' instead of 'M' to indicate that the series is non-existing). Else, 0's can be printed instead, for instance:
option series array print missing = zero;
prt <n> x[#e, #a];
x[k, 4] x[s, 4] x[k, 5] x[s, 5]
2011 63.0000 0.0000 35.0000 26.0000
2012 65.0000 0.0000 37.0000 M
Here, it is hard to tell from the print whether the sub-series x[s, 4] exists or not. Finally, the column may be skipped altogether with skip, for instance:
option series array print missing = skip;
prt <n> x[#e, #a];
x[k, 4] x[k, 5] x[s, 5]
2011 63.0000 35.0000 26.0000
2012 65.0000 37.0000 M
This corresponds to what GAMS does when printing, and is practical for sparse data.
3. Third option: data missing
Finally, there is option series data missing. This option is normally set to m (missing), but if set to zero, any expression containing a databank timeseries (either a normal series or array-subseries) with a missing data value will be interpreted as if the data value was 0. We may try the following, again building upon the example at the start of this page:
option series array calc missing = zero;
option series data missing = zero;
prt <n> sum((#e, #a), x[#e, #a]);
sum((#e, #a
), x[#e, #a])
2011 124.0000
2012 102.0000
The first option handles the missing sub-series x[s, 4], whereas the second option handles the missing data value x[s, 5][2012]. Another example could be a print without summing. In that case, the #e and #a lists are non-controlled, and option series array calc missing will not have any effect. Instead, option series array print could be used:
option series array print missing = zero;
option series data missing = zero;
prt <n> x[#e, #a];
x[k, 4] x[s, 4] x[k, 5] x[s, 5]
2011 63.0000 0.0000 35.0000 26.0000
2012 65.0000 0.0000 37.0000 0.0000
Instead, the following option is perhaps more suitable:
option series array print missing = skip;
option series data missing = m; //default
prt <n> x[#e, #a];
x[k, 4] x[k, 5] x[s, 5]
2011 63.0000 35.0000 26.0000
2012 65.0000 37.0000 M
Here, the missing sub-series x[s, 4] is skipped, and the missing data value x[2, 5][2012] is shown as M.
Combining the options, and the <missing = ignore> option
The above-mentioned options can be combined:
option series array print missing = skip;
option series array calc missing = zero;
option series data missing = zero;
prt <n> sum((#e, #a), x[#e, #a]), x[#e, #a];
sum((#e, #a
), x[#e, #a]) x[k, 4] x[k, 5] x[s, 5]
2011 124.0000 63.0000 35.0000 26.0000
2012 102.0000 65.0000 37.0000 0.0000
The first column is the sum of the next three colums, and the missing sub-series x[k, 5] and missing data value x[2, 5][2012] are handled as if they were 0. Note that in the first column, #e and #a are controlled by the sum function (and thus managed by the array calc option). The column corresponding to x[s, 4] is skipped, because it does not exist, and this is managed by the array print option for uncontrolled indexes.
Since a print like the above is often practical if missing series and missing data values are to be ignored, Gekko contains the local option <missing = ignore> for both PRT/PLOT, but also for assignments. The local option sets the following options temporarily, and reverts them after the statement:
option series array print missing = skip;
option series array calc missing = zero;
option series data missing = zero;
Example:
prt <n missing = ignore> sum((#e, #a), x[#e, #a]), x[#e, #a];
y <missing = ignore> = sum((#e, #a), x[#e, #a]);
prt <n> y;
sum((#e, #a
), x[#e, #a]) x[k, 4] x[k, 5] x[s, 5]
2011 124.0000 63.0000 35.0000 26.0000
2012 102.0000 65.0000 37.0000 0.0000
y
2011 124.0000
2012 102.0000
The first of the above options is set to skip, not zero, to avoid printing of superfluous uncontrolled array-subseries that do not exist.
Illegal mathematical operations
option series data missing only affects data values directly accessed from a timeseries (possibly array-subseries) residing in a databank, and not for instance the results of expressions, functions, etc. Example:
reset; time 2011 2012;
option series data missing = zero;
y1 = -2, 2;
ly2 = log(y1);
prt <n> log(y1), ly2;
log(y1) ly2
2011 M 0.0000
2012 0.6931 0.6931
In this print, with option series data missing = zero;, log(y1) has a missing in 2011, whereas ly2 is 0 in 2011. The reason is that in log(y1), the missing value does not originate from a missing data value in a databank series (rather, the missing values stems from the mathematical operation log(-2)), whereas in the y2 case, the missing value does originate from a data value in a databank series (ly2, stored in the first-position databank, has a missing value in 2011). With option series data missing = m;, we would get
log(y1) ly2
2011 M M
2012 0.6931 0.6931
In GAMS, we get the following:
set t /2011, 2012/;
parameter y1(t);
parameter ly2(t);
y1('2011') = -2;
y1('2012') = 2;
ly2(t) = log(y1(t));
display ly2; //display log(y1) or log(y1(t)) is not legal
2011 UNDF, 2012 0.693
So GAMS calculates and stores ly2 in 2011 as 'undefined' (UNDF), not 0.
Note
See also this Gekko blog post on array-series: http://t-t.dk/gekko/array-series.