|
<< Click to Display Table of Contents >> DECOMP |
  
|
|
<< Click to Display Table of Contents >> DECOMP |
|
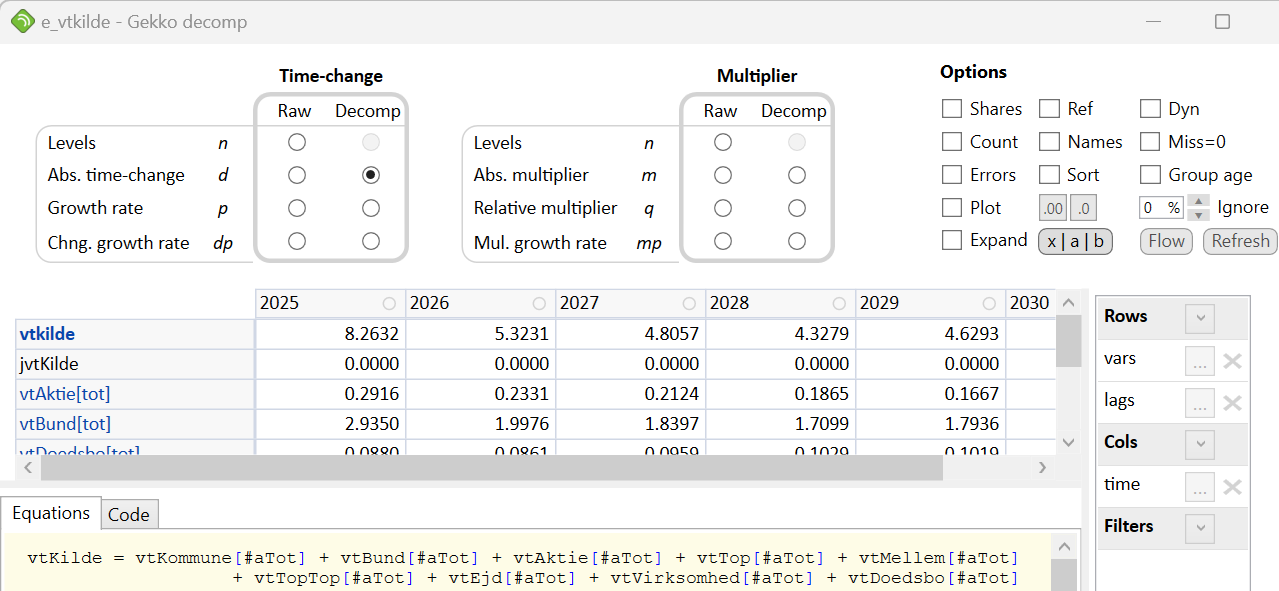
The DECOMP statement analyzes model equations, trying to figure out why a particular variable changes from period to period, or from a reference databank to a 'multiplier' databank. DECOMP uses is a linearization of the model equations, in order to calculate the contributions. Consider the model equation y = p1 * x1 + p2 * x2 where y could be a volume in current prices of the quantities x1 and x2, with prices p1 and p2. If y changes by 2%, how do p1, p2, x1 and x2 contribute to that change? Gekko can compute these contributions/explanations, and also link up with other equations if needed. If for instance x1 = c1 * x and x2 = c2 * x, Gekko can merge these x1 and x2 equations into the y equation, essentially transforming it into y = (p1 * c1 + p2 * c2) * x, where changes in y can now be explained by changes in p1, p2, c1, c2, and x.
DECOMP works both with normal Gekko models and GAMS-type dimensional models (cf. descriptions under the MODEL statement). Regarding GAMS-type models, a so-called scalar representation of the model is needed. For Danish language speakers, there are these detailed examples (decomposing the particular GAMS and Gekko models MAKRO and ADAM). These examples are self-contained (containing both models and data) and do not presuppose any GAMS installation.
In combination with DECOMP, Gekko also has a flowgraph functionality, activated by pressing the Flow button (alternatively, you may call the flowgraph directly via the FLOW statement). This will show a flowgraph containing recursive decomposition to depth = 2 (default). In the flowgraph window, you may also change the Ignore percentage in order to remove irrelevant arrows and boxes, the flowgraph may be rotated, and the [-] and [+] buttons are for zooming.
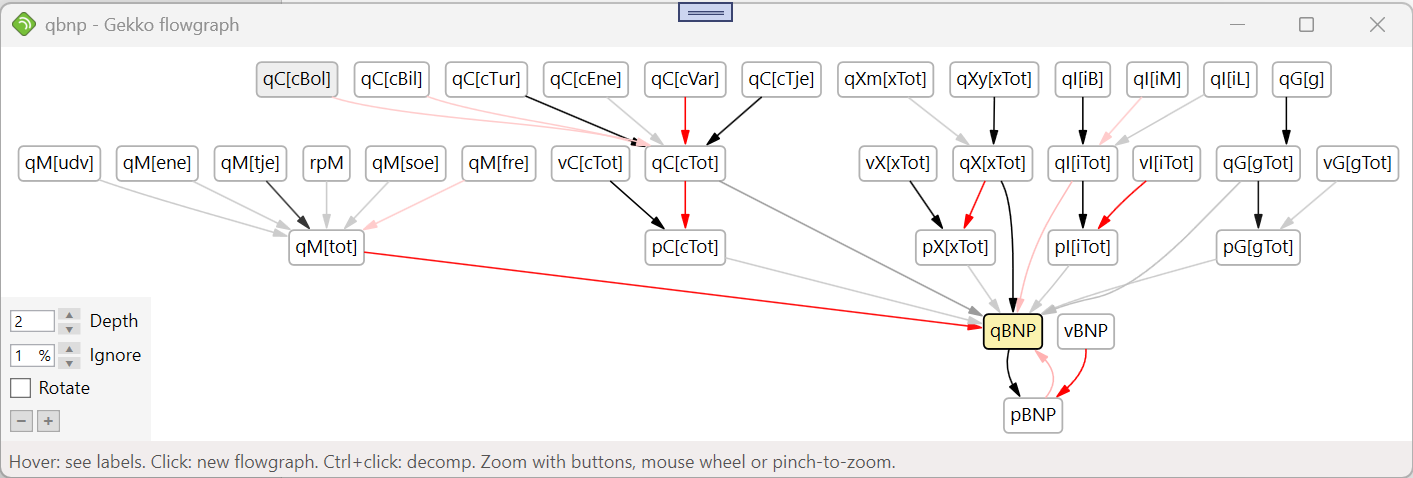
When hovering over the boxes, variable labels are shown, while clicking a box opens up a new flowchart window. With Ctrl+click, a new DECOMP window is opened instead. The current help page is pretty basic right now, just describing the syntax.
Mouse use in the DECOMP window •You can use mouse-hovering. •Clicking a variable in a Gekko .frm model opens a new DECOMP window (use Ctrl-click to open up a FIND window instead). •Clicking a variable in a GAMS scalar model opens up a new FIND window. |
decomp < period operator COUNT DYN ERRORS IGNORE= MISSING= NAMES SHARES SORT PLOT > variable FROM equations ENDO variables ROWS names COLS names;
decomp < period operator COUNT DYN ERRORS IGNORE= MISSING= NAMES SHARES SORT PLOT > variable;
period |
(Optional). Local period, for instance 2010 2020, 2010q1 2020q4 or %per1 %per2+1. |
operator |
(Optional). Operator, choose between n, d, p, dp, rn, rd, rp, rdp, m, q, mp. To show non-decomposed ('Raw') values, prefix with x, for instance xd or xm. |
COUNT |
(Optional). Show the number of elements hidden/aggregated inside the particular table cell. |
DYN |
(Optional). Resolve dynamic lagged/leaded variables. For instance, without DYN an equation like y = 0.5 * y[-1] + x; will show contributions from y[-1] and x, when y is decomposed. When using DYN, the equations is resolved over time, in effect unrolling it into y = x + 0.5 * x[-1] + 0.25 * x[-2] + ... ; and hence showing effects from x, x[-1], x[-2], etc. Note that DYN strongly depends upon the particular time period, so try using DYN on a sample containing a few periods first (note: DYN has no effects on a 1-period sample). Using DYN on a long period may be very time-consuming, because of matrix inversion. |
ERRORS |
(Optional). Show residuals and non-linear errors. Residuals are data errors in the equations (differences between left- and right-hand sides). •Data residuals should normally be = 0 for simulated values. Note that when equations are linked, residuals for each equation show up (Residual1, Residual2, etc.). •Errors originate from possible non-linearities in the equation(s) (for a linear equation, these errors should be = 0). If the variables are shown on rows, the error value is computed so that the first row equals the sum of the rest of the rows. With this option, the yellow/orange/red circled markers are generally absent, because the contributions sum up to the dependent variable per definition (the Error row/column makes sure of that). |
IGNORE= |
(Optional). Ignores small values. For instance, IGNORE=1 will filter out contributions amounting to less than 1% contribution to the change in the dependent variable. When ignoring, yellow/orange/red circled markers may show up, notifying that the shown contributions do not sum up to the dependent variable. Default: 0. |
MISSING= |
(Optional). With missing=ignore, missing values are treated as zeroes. The following options are set locally and reverted afterwards: option decomp_array_calc_missing = zero; |
NAMES |
(Optional). Show the names of the elements 'hidden' inside the particular table cell. |
SHARES |
(Optional). Show values as shares of the chosen ('dependent') variable. If variables are shown on rows, the rows are normalized so that the first row equals 100%. |
SORT |
(Optional). Sort the values by numerical size. |
PLOT |
(Optional). Shows a plot instead of a table. Like PLOT, the plot is produced by gnuplot, internally using .svg files. You may hover over lines to see variable names. You may zoom the plot size using option decomp plot zoom = ... ; (default = 100). |
variable |
The (dependent) variable that is to be decomposed. This variable is always shown first in the rows/columns. |
FROM |
Indicate a list of equation names, containing the equations that are to be used. For GAMS models, the equations may be lagged/leaded, like for instance E_y[-1], to make it possible to decompose for y in an equation like E_y[t] .. y[t+1] =E= x[t] + 1;. |
ENDO |
Indicate the endogenous variables. If there is only one equation, ENDO contains the name of the (dependent) variable that is being decomposed. If there are more than one equation, the (dependent) variable will be part of the list, and ENDO tells Gekko how to link up the equations. These variables are "substituted out" and do not show up as contributions (except for the dependent variable). |
ROWS |
Fields to show on rows, for instance: vars, lags. |
COLS |
Fields to show on columns, for instance: time. |
•If no period is given inside the <...> angle brackets, the global period is used (cf. TIME).
If you want to decompose a particular variable but do not know which equation it is determined in, you can use DECOMP without the FROM and ENDO parts, for instance decomp x1; to find all equations containing x1.
For 'Raw' operators (left part of operator columns).
•'Shares' cannot be selected.
•'Dyn' has no effect.
•'Errors' will only show residuals (shown last).
•'Sort' will sort according to levels. Residuals will be sorted, too.
•'Ignore' will be ignored.
For 'Decomp' operators (right part of operator columns).
•'Shares' will show relative values (relative to the chosen/dependent variable).
•'Errors' shows residuals, ignored and errors. Residuals are shown after other variables, unless 'Sort' is chosen. Ignored are always shown second-last (when active), and errors are always shown last. When 'Errors' is not selected, a yellow/orange/red circle shown at the time period label will indicate that 'Errors' contain significant contributions.
•'Sort' will sort according to relative values (relative to the chosen/dependent variable). Residuals will be sorted, too.
•'Ignore' will gather all contributions with relative values smaller than the chosen value. The 'Ignore' component may include residuals (but will always exclude errors).
Decompose the variable y from the equation e1:
decomp <2010 2020 m> y from e1; |
If there are two interconnected equations, you may link them with the following (decomposing y using the two equations e1 and e2, with the variables y and c set as endogenous variables):
decomp y from e1, e2 endo y, c; |
Same as before, this time using array-series:
decomp x[y] from e1, e2 endo x[y], x[c]; |
This shows a list of equations containing x[y], corresponding to using the FIND window:
decomp x[y]; |
To quickly close all DECOMP windows, you may use the CUT statement or the "Close all plot/decomp/flowgraph/trace windows" button in the Gekko main window. When using this button, and if the Gekko main window is out of focus, you may have to click the button two times (the first time brings the Gekko main window back in focus).
When a DECOMP statement is issued, Gekko takes a copy (data snapshot) of the first-position and Ref (reference) databanks, for use with subsequent DECOMP windows. If you issue a new DECOMP statement while there are still old unclosed DECOMP windows floating around, these windows will also be linked to the new data snapshot. Use the "Refresh" button to load data from databanks into the data snapshot.
Missing values are shown as M, and missing variables are shown as N.
You may copy-paste decomp cells to a spreadsheet (mark cell areas or use Ctrl+A, followed by 'Copy' or Ctrl+C). When pasting into for instance Excel, make sure that option interface clipboard decimalseparator corresponds to you Excel settings, and also make sure that your decimal separator is different from your thousands separator (if these are both . or both , numbers may become garbled). In Excel, see File --> Options --> Advanced --> Editing options.
In a Gekko model, when clicking on a variable x to find the equations it is part of, only equations where x appears non-lagged/leaded are listed. This restriction will be relieved.
When looking for series and array-series names, autocomplete ([Tab] or [Ctrl+Space]) can be practical as a supplement to the INDEX statement.
option interface clipboard decimalseparator = period;
option decomp_array_calc_missing = m;
option decomp_data_missing = m;
option decomp flowgraph depth = 2;
option decomp maxlag = 10;
option decomp maxlead = 10;
option missing = error;
option decomp plot zoom = 100;
CUT, FIND, FLOW, MODEL, MULPRT, PRT, PLOT