|
<< Click to Display Table of Contents >> Functions |
  
|
|
<< Click to Display Table of Contents >> Functions |
|
Gekko has a number of in-built functions, listed below. Note that all Gekko functions implement so-called UFCS on the first function argument, so that a function like for instance f(x, y) can generally be written as x.f(y), and f(x) can generally be written as x.f().
Mathematical functions:
Function name |
Description |
Examples |
abs(x) |
Returns the absolute value of x (series/val/matrix). Returns: series/value/matrix |
%v1 = abs(%v2); |
avg(x1, x2, ...) |
Returns the average of x1, x2, ... etc. The input parameters may be series or value. Returns: series/value |
y = avg(x1, x2, x3); |
avgt(x) avgt(<t1 t2>, x) |
Returns the time-average of the observations of the timeseries x over the local/global time period (or over t1 to t2, if indicated) Returns: series |
y = avgt(x); |
ceiling(x) |
Returns the the smallest integer which is greater than or equal to x (series/value/matrix). See also int(), floor() and round(). Returns: series/value/matrix |
prt ceiling(-2.2); |
dif(x) or diff(x) |
Absolute time-difference of series x: can also be used on left side of =. Does not work on value. Returns: series |
y = dif(x); |
difa(x) or diffa(x) dify(x) or diffy(x) |
Year-over-year absolute time-difference. Same as dif(x), but will use 4 lags for quarterly data, and 12 lags for monthly data. See also <yoy> option for PRT/PLOT etc. All four functions do the same. Returns: series |
y = difa(x); |
difq(x) or diffq(x) |
Quarterly difference. Same as dif(x), but will use 3 lags for monthly data. Returns: series |
y = difq(x); |
dlog(x) |
Logarithmic time-difference of series x: can also be used on left side of =. Does not work on value. Returns: series |
y = dlog(x); |
dloga(x) dlogy(x) |
Year-over-year logarithmic time-difference. Same as dlog(x), but will use 4 lags for quarterly data, and 12 lags for monthly data. See also <yoy> option for PRT/PLOT etc. Returns: series |
y = dloga(x); |
dlogq(x) |
Quarter-over-quarter logarithmic time-difference. Same as dlog(x), but will use 3 lags for monthly data, Returns: series |
y = dlogq(x); |
eps() |
Return a very small number (1e-300), to represent an eps value that is for practical purposes zero, but has special meaning and calculation rules (like missing values also have). For instance, the following return the eps value: -eps(), eps()+eps(), eps()-eps(), eps()*eps(), whereas the following return a missing value: eps()/eps() and log(eps()). Note that exp(eps()), returns 1.
You may use isEps() or is0OrEps() to check whether a value is eps. |
x = eps(); |
exp(x) |
Returns the exponential value of x (series/value/matrix). Returns: series/value/matrix. |
y = exp(x); |
floor(x) |
Returns the largest integer which is less than or equal to x (series, val or matrix). See also int(), ceiling() and round(). Returns: series/value/matrix |
prt floor(-2.2); |
iif(in1, op, in2, out1, out2)
|
Conditional, works like an if statement. Think of it like if in1 op in2 then out1 else out2, where op is a string containing the operator ==, <>, <, <=, >=, >. The function can be used to avoid explicit time looping for timeseries. The op input must be a string, and the rest of the inputs must be of math type (there is another iif()-example here). If needed, you can use == (or <>) together with m() to test for the presence of missing values, see example.
You may alternatively use $-conditionals, see examples under SERIES. See also the replace() and isMiss() functions for series. Returns: series/value |
time 2010 2012; |
int(x) |
Returns the integer value of x (series/val/matrix), discarding the fractional part (after the .). See also floor(), ceiling() and round(). Returns: series/value/matrix |
prt int(-2.2); |
is0OrEps(x) |
The input parameter x may be series or value, and the function returns 1 or 0 (or 1's and 0's) depending upon whether the input values are either 0 or eps, or otherwise. Cf. also the eps() function. |
time 2021 2023; x[2023] = 0; prt is0OrEps(0) |
isEps(x) |
The input parameter x may be series or value, and the function returns 1 or 0 (or 1's and 0's) depending upon whether the input values are eps, or otherwise cf. the eps() function. |
time 2021 2023; |
isMiss(x) isMiss(x, 'all') |
The input parameter x may be series or value, and the function returns 1 or 0 (or 1's and 0's).
If x is a series, the first variant of the function returns 1, else 0, over the period that contains data (cf. fromSeries(x, 'dataStart') and fromSeries(x, 'dataEnd')). With option 'all', the local or global period is used instead.
An example is provided regarding how to replace missing values inside series, but note that this can also be done with the iif() or replace() functions.
See also allMiss().
Returns: series/value |
prt isMiss(1); prt isMiss(miss()); |
lag(x, lag) |
Lags series x a number of periods. Note the sign of the lag: lag(x, 2) = x[-2]. Can be used if x is an expression. Returns: series |
y = lag(x, 2); //same as x[-2] |
log(x) |
Returns the natural logarithmic value of x (series/value/matrix). Can also be used on the left side of =. Returns: series/value/matrix |
y = log(x); log(y) = a * log(b); |
m() or miss() |
Returns a missing value. Useful in some series or matrix expressions. Cf. also the m(..., ...) function for matrices. Returns: value |
y <2020 2020> = m(); |
max(x1, x2, ... ) |
Finds the largest value. Arguments may be value, series or date. Returns: value/series/date.
|
prt max(2, 4, 1, 3); |
min(x1, x2, ... ) |
Finds the lowest value. Arguments may be value, series or date. Returns: value/series/date.
|
prt min(2, 4, 1, 3); |
mod(x1, x2) |
Modulo, the remainder of the division x1/x2. Returns: value/series. |
%x = mod(7, 4); //3 |
movavg(x1, lags) |
Moving average of series x1. Returns: series |
y = movavg(x, 3); |
movsum(x1, lags) |
Moving sum of series x1, cf. movavg(). Returns: series |
y = movsum(x, 3); |
pch(x) |
Percentage growth in series x: can also be used on left side of =. Does not work on value. Returns: series |
y = pch(x); |
pcha(x) pchy(x) |
Year-over-year growth. Same as pch(x), but will use 4 lags for quarterly data, and 12 lags for monthly data. See also <yoy> option for PRT/PLOT etc. Returns: series |
y = pcha(x); |
pchq(x) |
Quarterly growth. Same as pch(x), but will use 3 lags for monthly data. Returns: series |
y = pchq(x); |
pow(x, y) power(x, y) |
The exponent must be a value, not a series. The function pow(x, y) is equal to x**y or x^y, that is, x in the y'th power. You may use power(x, y) as synonym. Returns: series/value |
y = pow(x1, %x2); |
rnorm(mean, var) rnorm(mean, vcov) |
Returns a random number from a normal distribution with mean and variance provided. If fed with a n x 1 matrix of averages, and a n x n covariance matrix, the function will return a n x 1 matrix of values. See also rseed() and runif(). Returns: value/matrix |
%n = rnorm(0, 1); |
rseed(x) |
Given value x, it sets a random seed for runif() and rnorm() functions. The function returns the seed as a value, but can be used without return value. Returns: value |
rseed(12345); |
round(x, d) |
Rounds x (series, val or matrix) to d decimal places. See also int(), floor() and ceiling(). Returns: series/value/matrix |
%v1 = round(%v2, 3); |
runif() |
Returns a random number from a uniform distribution between 0 and 1. See also rseed() and rnorm(). Returns: value |
%v = runif(); |
seq(start, end) |
Returns a list of integer values or dates between start and end (both included). Start and end must be two values or two dates. Returns: list |
#m = seq(1, 100); |
sqrt(x) |
Returns the square root of x (series/value/matrix). Returns: series/value/matrix |
y = sqrt(x); |
sum(x1, x2, ...) sum(list, x) |
Returns the sum of x1, x2, ... etc. The input parameters may be series or value. If the first argument is a list name (or a list of list names), the sum function will sum the second argument over these lists. Returns: series/value |
y = sum(x1, x2, x3);
y = sum(#j, x[a, #j]);
To sum a simple list #j of series names, you may use this:
y = sum({#j}); //shorter than sum(#j, {#j})
Note that for PRT/PLOT etc., you should use the more explicit PRT sum(#j, {#j}); because PRT/PLOT auto-unfolds 'uncontrolled' lists into columns/lines. |
sumt(x) sumt(<t1 t2>, x) |
Returns the time-sum of the observations of the timeseries x over the local/global time period (or over t1 to t2, if indicated) Returns: series |
y = sumt(x); |
tanh(x) |
Returns the hyperbolic tangens of x (series/value/matrix). Returns: series/value/matrix |
%x = tanh(0.5); |
tiny() |
Returns a very small number (1.7777e-301), which can be useful to guard against for instance 0's in fractions, cf. example. |
x1 = 1; x2 = 2; |
Conversions
Function name |
Description |
Examples |
date(x) |
Tries to convert the scalar x to date type. See also under "date combining functions". Returns: date |
%d = date(2000+15); |
dates(x) |
Tries to convert each element of the list x into a date. Returns: list |
#m1 = (2001, 2002, 2003); |
data(x) |
Converts a string x containing blank-separated numbers to a list of values. Can be practical if you have data input in blank-separated form. Returns: list of values |
#m = data('1 2 3'); |
format(x, code)
|
Formats the value/date/string x by means of the formatting code. The formatting code is as follows for values:
'[width]:[format]'
The width specifies that the string will be at least [width] characters wide. If the [width] is positive, the number is right-aligned within the field, and if it is negative, it is left-aligned.
The [format] follows the conventions shown here or here, so you may either use a pattern like 0.000 or 0.### (exactly three digits or at most three digits), or you may use a description like F3 (floating point, three digits). So 12:0.000 or 12:F3 are both a 12 characters wide field, and a number with three decimals.
The [culture] argument after an optional = symbol changes how thousands and decimal operators look like. For instance, en-US is English (US variant), da-DK is Danish, see the possible cultures here. So format(1234567.8987, '0,0.00=da-DK') will return 1.234.567,90. Without culture, it would return 1,234,567.90.
A value format can be set globally with option string interpolate format val = ... ;. This can be practical when printing out for instance a table of values with the same value formatting.
You may also format strings or dates: in that case only [width] can be used (positive or negative). In this way, table-like alignment is quite straightforward.
Returns: string. |
%v = 12.3456; %d = 2020q1; // 2020q1| // 2020q1 | |
string(x) |
Tries to convert the scalar x to string type. See also under "string combining functions". If x is a list of strings, the string() function returns a comma-separated list of strings. Returns: string |
%s = string(12) + string(34); |
strings(x) |
Tries to convert each element of the list x into a string. Returns: list |
#m1 = (1, 2, 3); |
val(x) |
Tries to convert the scalar x to value type. Returns: value |
%v = val('12' + '34'); |
vals(x) |
Tries to convert each element of the list x into a value. Returns: list |
#m1 = ('1', '2', '3'); |
Date combining functions
Function name |
Description |
Examples |
||||||||||||||||||||||||||||||||
date(d, f, opt) date(d, f) |
Converts the date d into a new date with frequency f (string). The optional option can be omitted, or be 'start' or 'end'. Using 'start' or 'end' is only relevant when converting from a lower to a higher frequency.
Beware that week numbers are special around New Year.
Returns: date |
%d = 2021q1; prt %d.date('m'); //error! |
||||||||||||||||||||||||||||||||
date(y, f, sub) date(y, 'm', m, 'd', d) |
Constructs a new quarterly/monthly/weekly date from year y (integer), frequency f (string), and subperiod sub (integer). You may also construct a daily date with a similar syntax.
Note: you may also use date(x), where x can be a value or a string, and Gekko will try to convert the argument into a date.
Returns: date |
%d = date(2020, 'q', 2); //2020q2 |
||||||||||||||||||||||||||||||||
fromExcelDate(v) |
Converts an Excel date (the value v, counting the number of days since January 1, 1900) to a date with daily frequency.
Returns: date (daily) |
See examples regarding the toExcelDate() function. |
||||||||||||||||||||||||||||||||
getFreq(d) |
Extracts the frequency of a date d. Returns: string |
%d = 2020q2; |
||||||||||||||||||||||||||||||||
getDay(d) |
Extracts the day number from a date d. Will fail if the date is not daily. Returns: value (integer) |
%d = 2020m3d25; |
||||||||||||||||||||||||||||||||
getSpecialDay(year, name) |
Finds a special day by year (value) and name (string), and returns its daily date. Mostly used for holidays. If you input a wrong name, Gekko will provide a link showing all possible special days. Current possible holiday names (English, and equivalent Danish names):
Note that getSpecialDay(%year, 'Leap_Day') may return a null value, else it returns February 29 in leap years. The leap day is not a holiday, but is nevertheless kept in this list of special days. See example. |
prt 2021.getSpecialDay('Easter_Sunday'); //2021m4d4 |
||||||||||||||||||||||||||||||||
getMonth(d) getMonth(d, lang) |
Extracts the month number from a date d. More specific than getSubPer(), and will fail if the date is not monthly or daily.
You may input a language lang ('en' = English, 'da' = Danish), in which case a string is returned.
Returns: value (integer) or string |
%d = 2020m2; |
||||||||||||||||||||||||||||||||
getQuarter(d) |
Extracts the quarter number from a date d. More specific than getSubPer(), and will fail if the date is not quarterly. Returns: value (integer) |
%d = 2020q2; |
||||||||||||||||||||||||||||||||
getSubPer(d) |
Extracts the sub-period from a date d (1 if annual or undated, the quarter if quarterly, the month if monthly or daily, and the week if weekly). Returns: value (integer) |
%d = 2020q2; |
||||||||||||||||||||||||||||||||
getWeek(d) |
Get the week number from a date d of weekly frequency. Does not accept daily frequency as argument, but the conversion date('w') can be used as intermediary for this (see examples). Beware that the year may change when converting from daily to weekly frequency. Returns: value (integer) |
%d = 2020w20; p %d.getWeek(); //error! |
||||||||||||||||||||||||||||||||
getWeekday(d) getWeekday(d, lang) |
Extracts the weekday number from a date d. Will fail if the date is not daily. The numbers are as follows: Monday = 1, Tuesday = 2, Wednesday = 3, Thursday = 4, Friday = 5, Saturday = 6, Sunday = 7.
You may input a language lang ('en' = English, 'da' = Danish), in which case a string is returned.
Returns: value (integer) or string. |
%d = 2020m3d25; |
||||||||||||||||||||||||||||||||
getYear(d) |
Extracts the year from a date d. Returns: value (integer) |
%d = 2020q2; |
||||||||||||||||||||||||||||||||
max(d1, d2, ... ) |
Finds the largest of any number of dates. (max() can also be used with value arguments). Returns: date |
prt max(2002q1, 2001q4); |
||||||||||||||||||||||||||||||||
min(d1, d2, ... ) |
Finds the smallest of any number of dates. (min() can also be used with value arguments). Returns: date |
prt min(2002q1, 2001q4); |
||||||||||||||||||||||||||||||||
observations(d1, d2) |
Counts the number of observations (periods) between date d1 and date d2, with both start and end date included. The date difference using - is always the same as the number of observations minus 1. |
prt observations(2020q2, 2023q3); //14 |
||||||||||||||||||||||||||||||||
toExcelDate(d) |
Converts a daily date d into an Excel date (counting the number of days since January 1, 1900). See also fromExcelDate(). Excel dates can be subtracted to obtain day spans.
Returns: value. |
%v1 = toExcelDate(2019m11d12); |
||||||||||||||||||||||||||||||||
truncate(d1, d2) |
Finds overlap between two different time periods. The period d1 to d2 is compared with the global time period (if no local period is indicated), or with the local time period (if such a period is indicated in the <...> fields). Use a local time period if you need to find the overlap between two arbitrary time windows.
Returns: a list of two elements, start and end date of the resulting period. If the two elements are both null, there is no overlap. |
time 2010 2020; // // The overlapping period (z) can be visualized as // the overlap of these time windows/periods: // // period1 . x x x x x . . . // period2 . . . y y y y y . // truncate() . . . z z z . . . |
String combining functions
Function name |
Description |
Examples |
[x]-index |
Index: returns the character at position x (integer). Returns: string |
%s = 'abcd'; |
[x1..x2]-index |
Index: returns the range of characters from position x1 to x2 (both inclusive, integers). You may omit x1 or x2. Returns: string |
%s = 'abcd'; prt %s[2..]; //'bcd' |
concat(s1, s2) |
Appends the two strings: same as s1 + s2. Returns: string |
%s = concat('He', 'llo'); Result: 'Hello'. |
endswith(s1, s2)
|
Returns 1 if the string s1 ends with the string s2, else 0. The comparison is case-insensitive. Returns: val |
%v = endswith('abcde', 'cde'); |
includes(s1, s2) |
Returns 1 if the string s2 is found inside (as a part of) string 1, else 0 is returned. The search is case-insensitive. Note that the contains() function is not useful regarding such in-string searches. Returns: val |
%s = 'abCd'; |
index(s1, s2) |
Searches for the first occurrence of string s2 in string s1 and returns the position. It returns 0 if the string is not found. The search is case-insensitive Returns: val |
%v = index('onetwothreetwo', 'two'); Returns: 4. Returns: 4. |
isAlpha(s) |
Returns 1 if all the characters of the string s are letters (alphabet). |
%v = isAlpha('aBc'); |
isLower(s) |
Returns 1 if the string s contains no uppercase characters. |
%v = isLower('abc12'); |
isNumeric(s) |
Returns 1 if all the characters of the string s are of numeric value. |
%v = isNumeric('123'); |
isUpper(s) |
Returns 1 if the string s contains no lowercase characters. |
%v = isUpper('ABC12'); |
length(s) len(s)
|
The length of the string s (number of characters). You may use len() instead of length(). Returns: val |
%v = %s.length(); |
lower(s) |
The string s in lower-case letters. Returns: string |
%s = lower('aBcD'); Result: 'abcd'. |
nl() |
A system newline/linebreak. Computerwise, nl() is equal to the C# string "\n", but beware that you cannot use the Gekko string '\n' instead of nl(), because the former is equal to the C# string "\\n". Returns: string |
%s = 'a' + nl() + 'b'; //string with newline |
prefix(s1, s2) |
If s1 is a string, it has the string s2 prefixed (prepended). Returns: string |
%s1 = %s2.prefix('a'); |
replace(s1, s2, s3) replace(s1, s2, s3, max) |
In the string s1, the function replaces all occurrences of s2 with s3. Replacement is case-insensitive.
If max > 0, the replacement is performed at most max times.
Returns: string |
%s = replace(%s1, %s2); //or: replace(%s, %s1, %s2) |
split(s1, s2) split(s1, s2, removeempty) split(s1, s2, removeempty, strip) |
Splits the string s1 by means of the delimiter s2. Empty elements are removed per default, and the resulting strings are stripped (blanks are removed from the start and end of the strings). The last two options are 1 and 1, if omitted. |
%s = 'a, b,c,,d, , e'; |
startswith(s1, s2) |
Returns 1 if the string s1 starts with the string s2, else 0. The comparison is case-insensitive. Returns: val |
%s = 'abcde'; |
strip(s) |
Removes blank characters from the start and end of the string s. Returns: string |
%s1 = %s2.strip(); //or: strip(%s1) |
stripstart(s) |
Removes blank characters from the start of the string s. Returns: string |
%s1 = %s2.striptart(); //or: stripstart(%s1, %s2) |
stripend(s) |
Removes blank characters from the end of the string s. Returns: string |
%s1 = %s2.stripend(); //or: stripend(%s1, %s2) |
substring(s, start, length) |
The piece of the string s between character number start and length (these must be integer values).
You can alternatively use a 'slice', using []-notation, see example.
Returns: string |
%s = %s1.substring(3, 2); //or: substring(%s1, 3, 2) //a slice from pos 3 to 5 (both inclusive) |
suffix(s1, s2) |
If s1 is a string, it has the string s2 suffixed (appended) Returns: string |
%s1 = %s2.suffix('a'); |
upper(s) |
The string s with upper-case letters. Returns: string (works for list of strings, too) |
%s = upper('aBcD'); Result: 'ABCD'. |
upperFirst(s) |
The string s with upper-case first letter. Returns: string (works for list of strings, too) |
%s = upperFirst('abcd'); Result: 'Abcd'. |
List functions:
Note that some of the functions assume that the lists are lists of strings.
Function name |
Description |
Examples |
[x]-index |
Index: picks out a single element (at integer x position). In contrast to R, this does not return a 1-element list containing the variable. If you need that, use for instance #m[3..3]. Returns: var |
#m[3]; //the third element |
[x1..x2]-index |
Index: picks out a range of elements. You may omit x1 or x2. Returns: list |
#m[3..5]; //the third to fifth elements #m[3..]; |
[x1, x2]-index |
For a nested list of lists, #m[3, 5] will return the same element as #m[3][5], so this is just a convenience to make a nested list accessible like a matrix. See more here. Returns: variable |
#m = ((1, 2), (3, 4)); |
[x1..y1, x2..y2]-index [x1..y1, x2]-index [x1, x2..y2]-index |
For a nested list of lists, #m[2..3, 2..4] will select the given 'rows" and "columns", corresponding to selecting a submatrix from a matrix. Beware that in general, #m[2..3, 2..4] is completely different from #m[2..3][2..4]. See more here. Returns: list |
// 1 2 3 |
append(x1, x2) append(x1, i, x2) |
Adds variable x2 as it is at the end of list x1. Note that if x2 is a list of for instance 3 items, only 1 element is added (the list itself). If you need to add the 3 elements individually, use extend().
If used with i argument, x2 is inserted at index i, instead of at the end. See also extend().
To prepend, use append(x1, 1, x2).
Returns: list |
#y = #x1.append(#x2); //or: append(#x1, #x2) |
contains(x1, x2) |
Checks if the list of strings x1 contains the string x2. Returns 1 if true, 0 otherwise. You may alternatively use "x2 in x1", see the last example. See also the count() and index() functions. The comparisons are case-insensitive. Returns: val |
%v = #x1.contains(%s); |
count(x1, x2) |
Counts the number of times the string x2 is present in the list of strings x1. See also the contains() and index() functions.
Note: to obtain the number of elements in a list, use the length() function. The comparisons are case-insensitive.
Returns: val |
%v = #x1.count(%s); //or: count(#x1, %s) |
data(x) |
Accepts a string of blank-separated values x and turns them into a list of values. This is handy for long sequences of blank-separated numbers, instead of manually setting the commas. Returns: list |
#m = data('1.0 2.0 1.5'); |
dates(x) |
Tries to convert each element of the list x to a date. Returns: list |
#y = dates(#x); |
except(x1, x2)
|
The except() function subtracts x2 from x1. You may alternatively use the operator -. Only works for lists of strings. See also intersect() and union(). See also extend().
Returns: list |
#y = #x1.except(#x2); //or: except(#x1, #x2) |
extend(x1, x2) extend(x1, i, x2) |
The arguments x1 and x2 must be lists. The function inserts the elements of list x2 one by one at the end of (or at position i in) the list x1. The resulting list may contain dublets.
For two lists x1 and x2, you may alternatively use the + operator. See also except() and append().
To pre-extend, use extend(x1, 1, x2).
Returns: list |
#y = #x1.extend(#x2); //or: extend(#x1, #x2) |
flatten(x) |
For at list x, the function returns a flattened version of the list. For instance, the list (1, (2, 3)) is transformed into a non-recursive list of non-list elements: (1, 2, 3).
Returns: list
|
#m1 = (1, (2, 3)); |
index(x1, x2) |
Returns the index of the first occurrence of the string x2 in the list of strings x1. Returns 0 if x2 is not found in x1. See also the count() and contains() functions. The comparisons are case-insensitive. Returns: value (integer) |
%i = #x1.index(%s); //or: index(#x1, %s) |
intersect(x1, x2)
|
The intersect() function finds the common elements of the two list of strings x1 and x2. The resulting list will not contain dublets. You may alternatively use the operator &&. Only works for lists of strings. See also except() and union(). Returns: list |
#y = #x1.intersect(#x2); //or: intersect(#x1, #x2) |
join(x1, x2) |
For a string x1 and a list of strings x2, the method concatenates the x2 elements with x1 as separator. See also path(). Returns: string |
#m = ('x1', 'x2', 'x3'); |
length(x) len(x) |
Returns the number of elements in the list x. You may use len() instead of length(). Returns: val |
%v = #x.length(); //or: length(#x). |
list(x1, x2, ...) |
Returns a list of the variables x1, x2, etc. The function is handy for lists with only 0 or 1 elements. See examples. Returns: list |
#m = (); //will fail #m = (1, 2); //easy |
lower(x) |
Returns string elements in the list x as lower-case. Returns: list |
#y = #x1.lower(); //or: lower(#x1) |
path(x) |
For a list of strings x, the method concatenates the x elements with '\' as separator. See also join(), pathparts(). Returns: string |
#m = ('x1', 'x2', 'x3'); |
pop(x1, i) pop(x1) |
Removes the element at position i in the list x1. Removes the last element if called with pop(x). Returns: list |
#y = #x1.pop(2); //or: pop(#x1, 2) |
preextend(x1, x2) |
Same as extend(x1, 1, x2), putting the elements of x2 in the first position of x1. |
#y = #x1.preextend(#x2); //insert at position 1 |
prefix(x1, x2) |
If x1 is a list of strings, each element has the string x2 prefixed (prepended) Returns: list |
#y = #x1.prefix(%s); //or: prefix(#x1, %s); |
prepend(x1, x2) |
Same as append(x1, 1, x2), putting x2 in the first position of x1. |
#y = #x1.prepend(#x2); //insert at position 1 |
sort(x) sort(x, 'natural') |
Returns a sorted list of strings, provided that x is a list of strings. Sorting is case-insensitive. When the 'natural' argument is used, strings containing numbers will sort naturally, for instance returning a8, a9, a10, instead of a10, a8, a9. Returns: list |
#y = #x.sort(); //or: sort(#x) |
remove(x1, x2) |
Removes any string x2 from the list of strings x1. See also the except() function. Returns: list |
#y = #x1.remove(%s); //or: remove(#x1, %s); #y = #x1 - %s; //also legal |
reverse(x) |
Reverses list items. Returns: list. |
#x = a, b, c; |
replace(x1, x2, x3) replaceinside(x1, x2, x3) replaceinside(x1, x2, x3, max) |
replace(): In the list of strings x1, if this string element is the same as x2, x3 is inserted instead.
replaceinside(): the string element has any occurences of x2 inside the string replaced with x3. The replacements may be limited via the max argument.
Returns: list |
#y = #x1.replace(%x2, %x3); //or: replace(#x1, %x2, %x3) |
strings(x) |
Tries to convert each element of the list x to a string Returns: list |
#y = strings(#x); |
suffix(x1, x2) |
If x1 is a list of strings, each element has the string x2 suffixed (appended) Returns: list |
#y = #x1.suffix(%s); //or: suffix(#x1, %s); |
t(x) |
For a nested list of lists x, the t() function returns the transpose, similar to transposing a matrix. Returns: list (of lists) |
#m = ((1, 2), (3, 4)); |
union(x1, x2)
|
The union() function finds the union of the two lists x1 and x2. Alternatively use the operator ||. The resulting list will not introduce dublets, in contrast to the similar + operator (simple concatenation). Only works for lists of strings. See also except() and intersect(). Returns: list |
#y = #x1.union(#x2); //or: union(#x1, #x2) |
unique(x) |
Retains only those elements of list x that are unique (list of strings only). Returns: list |
#y = #x1.unique(); //or: unique(#x1) |
upper(x) |
Returns string elements in the list x as upper-case. Returns: list |
#y = #x1.upper(); //or: upper(#x1) |
vals(x) |
Tries to convert each element of the list x to a value Returns: list |
#y = vals(#x); |
venn(x1, x2)
|
For two lists of strings, this function prints out lists corresponding to a Venn diagram.
That is, intersection and two differences. For instance, venn(#m1, #m2) corresponds to printing out the following:
•#m1 && #m2 •#m1 - #m2 •#m2 - #m1
See also intercept(), except() and union(). Returns: nothing. |
#m1 = a, b, c, d, e; //Results: |
Bank/name/frequency/index manipulations
Function name |
Description |
Examples |
addBank(x, bank) |
If x does not have a bankname, a bankname bank (string) is added. The input x may be string or list. Returns: string or list |
%name = addBank('x!q', 'b2'); |
addFreq(x, freq) |
If x does not have a frequency, freq (string) is added. The input x may be string or list. Returns: string or list |
%name = addFreq('x', 'q'); |
getBank(x) |
Returns the bank part of x. The input x may be series, string or list. Returns: string or list |
%bank = getBank('b2:x!q'); |
getFreq(x) |
Returns the frequency part of x. The input x may be series, string or list. Returns: string or list |
%bank = getFreq('b2:x!q'); |
getFullName(bank, name, freq) |
Returns the full name corresponding to the input, where bank, name and freq are strings. Returns: string |
%name = getFullName('b2', 'x', 'q'); |
getFullName(bank, name, freq, index) |
Returns the full name corresponding to the input, where bank, name and freq are strings, and index is a list of strings. Returns: string |
%name = getFullName('b2', 'x', 'q', ('a', 'b')); |
getIndex(x) |
Returns the index part of x. The input x may be string or list. Returns: list |
#index = getIndex('b2:x!q[a, b]'); |
getName(x) |
Returns the name part of x. The input x may be series, string or list. Returns: string or list |
%name = getName('b2:x!q'); |
getNameAndFreq(x) |
Returns the name part of x. The input x may be series, string or list. Returns: string or list |
%name = getNameAndFreq('b2:x!q'); |
removeBank(x) |
Removes any bank in x. The input x may be string or list. Returns: string or list |
%name = removeBank('b2:x!q'); |
removeBank(x, bank) |
Removes any banks in x with the indicated bankname bank. The input x may be string or list. Returns: string or list |
%name = removeBank('b2:x!q', 'b2'); |
removeFreq(x) |
Removes any frequency in x. The input x may be string or list. Returns: string or list |
%name = removeFreq('b2:x!q'); |
removeFreq(x, freq) |
Removes any freq in x with the indicated freqname freq. The input x may be string or list. Returns: string or list |
%name = removeFreq('b2:x!q', 'q'); |
removeIndex(x) |
Removes any index in x. The input x may be string or list. Returns: string or list |
%name = removeIndex('b2:x!q[a, b]'); |
replaceBank(x, b1, b2) |
Replaces any banks in x having name b1 with name b2. The input x may be string or list. Returns: string or list |
%name = replaceBank('b2:x!q', 'b2', 'b3'); |
replaceFreq(x, f1, f2) |
Replaces any freq in x having freq f1 with freq f2. The input x may be string or list. Returns: string or list |
%name = replaceFreq('b2:x!q', 'q', 'm'); |
setBank(x, bank) |
The indicated bankname bank is set, even if a bankname exists already. The input x may be string or list. Returns: string or list |
%name = setBank('b3:x!q', 'b2'); |
setFreq(x, freq) |
The indicated freq is set, even if a frequency exists already. The input x may be string or list. Returns: string or list |
%name = setFreq('b2:x!q', 'm'); |
setName(x, name) |
The indicated name is set. The input x may be string or list. Returns: string or list |
%name = setName('b2:x!q', 'y'); |
setNamePrefix(x, p) |
The name of x has prefix p added.The input x may be string or list. Returns: string or list |
%name = setNamePrefix('b2:x!q', 'a'); |
setNameSuffix(x, s) |
The name of x has suffix s added.The input x may be string or list. Returns: string or list |
%name = setNameSuffix('b2:x!q', 'b'); |
Timeseries functions
Function name |
Description |
Examples |
allMiss(x) |
On a timeseries x, the function returns 1 if all observations are missing values ("no data at all"), else it returns 0. See also isMiss(), fromSeries('dataStart'), and fromSeries('dataStart'). |
time 2021 2023; |
arrayPack(name, lname) |
This function finds all non-array ("normal") timeseries in the first-position databank and puts them into a single 1-dimensional array-series called name. In addition, a list lname is created, containing the names of the "packed" timeseries.
Note that after the function is called, the first-position databank only contains the array-series and the list. See also arrayUnpack(). |
read adambank.gbk; //When writing the gdx file, the adam variable will //have domain names 'adamvars' and 't'. |
arrayUnpack(name) |
This function takes the 1-dimensional array-series called name from the first-position databank and transforms ("unpacks") all the elements of the array-series into normal timeseries. The function deletes the array-series before it returns. See also arrayPack(). |
read <gdx> adambk.gdx; //has adam variable inside |
balance(x, rowsum, colsum, rownames, colnames)
balance(x, rowsum, colsum, rownames, colnames, options) |
The balance() function optimizes input-output like "cells", where x is a 2-dimensional array-series with cells, rowsum is a 1-dimensional array-series with row sums, colsum is a 1-dimensional array-series with column sums, rownames is a list of rownames, and colnames is a list of column names.
The last options argument (optional) is a map variable, where the type of optimization can be set ('ras', 'gras', 'entropy', 'sqdif', 'sqrel', 'distdif', 'distrel'), linear restrictions on cells can be added, cells may be exogenized, and cell weights can be indicated. Only the 'ras' and 'gras' types are well-tested at the moment. Default is 'ras'.
Beware that the options parameter has special syntax due to being a map, but the syntax is pretty close to named paramters used in other computer languages.
See more in the balancing appendix. |
io1 = balance(io, rowsum, colsum, #rownames, #colnames); |
bankFlatten(t) bankFlatten(bank, t)
|
For the global (or locally given) period, all series and array-series are flattened. This means that over the global (or local) period, all values are set to their value in t. A bank name may be provided: if not, the first-position databank is used. |
time 1960 2022; |
bankReplace(x1, x2) bankReplace(bank, x1, x2) |
For the global (or locally given) period, in all series and array-series, the value x1 is replaced with x2. A bank name may be provided: if not, the first-position databank is used. |
time 1960 2022; |
binary(x) |
Converts a table-like nested list of strings into a corresponding array-series where the present elements (that is, the 'rows' of the nested list) are represented with value 1. The nested list must contain time info as the last element of each sublist. The function can be used to tranform a multidimensional GAMS set into a corresponding array-series. This can be convenient for printing, etc. |
time 2001 2002; |
collapse(x) collapse(x, method) collapse(x, freq) collapse(x, freq, method)
|
Function variant of the COLLAPSE statement, converting from higher to lower frequency. Note possible differences compared to COLLAPSE regarding the use of databanks and time periods.
You may input a frequency (freq), choose from 'a', 'q', 'm', 'w'. If frequency is not indicated, the function will per default collapse from d to m, w to m, m to q, or q to a.
The method argument can be 'total', 'avg', 'first', 'last', 'strict' or 'flex'. The last two of these indicate how missing values are handled. You may combine the first four and the last two of these with -, for instance 'avg-flex' to choose method 'avg' combined with missing handling 'flex'. Note that missing handling 'flex' is currently only available for collapse of daily (!d) series. Regarding these options, see the COLLAPSE statement.
You may use option collapse method = ... ; and option collapse missing d = ... ; to control default values for the method and missing handling. See OPTION.
Returns: series. |
time 2020 2020; |
flatten(x, d) |
Transforms 1 array-timeseries x into n normal timeseries with names reflecting the array-series dimensions and delimiter corresponding to the string argument d. For instance, an array-series npop defined over the two dimensions #sex and #age could contain the element (sub-series) npop[m, 40], which flatten() would turn into the normal series npop_m_40. |
npop = series(1); |
getDomains(x) |
Returns a list of strings (with the number of elements corresponding to the number of dimensions) containing the domain for each dimension of the array-series x, for instance '#i' or '*' (the latter means no domain). See also getFixType(), setFixType(), setDomains(). Returns: list |
#d = getdomains(x); //or: #d = x.getdomains(); |
getElements(x) |
Returns a nested list of strings, which for each dimension of the array-series shows which elements occur (in all sub-series). In the example on the right, the first dimension only contains a's, whereas the second dimension contains b and c. The returned list has as many elements as the dimensionality of the array-series. See also subseries(). |
x = series(2); prt x.getelements()[2]; // 'b', 'c' prt x.getelements()[2][1]; // 'b' |
getFixType(x) |
Returns the "fix" type of an array-timeseries x, where the return value can be 'variable' or 'parameter'. Array-series imported from GAMS gdx can be of variable or parameter type. See also setFixType(), getDomains(), setDomains(). Returns: string. |
//See example under setFixType() |
getParent(x) |
For an array-subseries x, its parent series is returned. See example. |
x = series(1); |
hpfilter(x, lambda) hpfilter(<t1 t2>, lambda) hpfilter(x, lambda, log) hpfilter(<t1 t2> x, lambda, log) |
Returns a HP-filtered version of series x. Lambda is normally 6.25 for annual, 1600 for quarterly, and 129600 for monthly series. An additional argument 0 or 1 may be added (1 if log-transforms are to be used inside the calculation). Time period may be indicated with t1 and t2. Returns: series |
y = hpfilter(x, 6.25); |
interpolate(x) interpolate(x, method) interpolate(x, freq) interpolate(x, freq, method) |
Function variant of the INTERPOLATE statement, converting x from lower to higher frequency. Note possible differences compared to INTERPOLATE regarding the use of databanks and time periods.
Method must be 'total' or 'avg' (optionally combined with Olsette/Cholette/Denton, for instance 'total-olsette' or 'avg-cholette').
Destination freq must be 'q', 'm', 'w', or 'd'. Per default, interpolate() will transform from a to q, q to m, m to d and w to d.
Returns: series. |
time 2020 2021; |
isArraySeries(x) |
Returns 1 if the variable x is an array-series, and 0 otherwise. |
x = series(1); |
isTimelessSeries(x) |
Returns 1 if the variable x is a timeless series, and 0 otherwise. |
x = timeless(100); |
laspchain(plist, qlist, t) laspchain(<t1 t2>, plist, qlist, t) laspchain(<t1 t2>, plist, qlist, t, option)
laspchain(vals, valsLag, t) laspchain(<t1 t2>, vals, valsLag, t) |
Laspeyres chain index for quantities. Can be used with either (a) two lists of strings, or (b) two timeseries. In both cases the result is a map containing two consistent aggregated series p and q (price and quantity). The price is set = 1 in the t period. A period can be indicated in the <t1 t2> field. The function is robust regarding missing values at the start or end of the time period.
(a): Two lists of strings (names)
The names inside the two lists indicate the series that are to be aggregated.
See also the bottom of the LIST help page.
(b): Two series (accumulation)
A different way to use the function is to input one series (vals) with values in current prices, and one series (valsLag) with values in the previous period's prices. From this, Gekko will compute the aggregate price and quantity.
If you need to fill out holes (missings) between non-missings, for instance in prices series, you can use the smooth() function or SMOOTH statement.
You may also use the method with optional 'zeros1' or 'zeros2' as the last argument. For 'zeros1', if vals is 0 for period t, the price index will be held constant between t-1 and t. For 'zeros2', if vals and valsLag both are 0 for period t, the price index will be held constant between t-1 and t.
Quarterly data
For quarterly data, using two lists of strings, option 'annualoverlap' must be indicated. When quarterly data are input, the so-called annual overlap method is used, where the algorithm starts out collapsing the quarterly data into annual data, then computes a "normal" annual chain index for the aggregate price, and lastly uses this annual price index to compute the quarterly indexes.
Returns: map |
time 2017 2020; |
laspfixed(plist, qlist, t) laspfixed(<t1 t2>, plist, qlist, t) laspfixed(<t1 t2>, plist, qlist, t, option) |
Laspeyres fixed-price index. As laspchain(), but with fixed prices. Cannot be used with series input.
Returns: map |
//See example regarding laspchain() |
percentile(x, v) |
Computes the v percentile for the series x, for the global time period. Any missing values within that sample are ignored. Setting v = 0.5 results in the median. Returns: val |
%z = percentile(y, 0.25); |
rebase(x, t) rebase(x, t, index) |
Function variant of the REBASE statement. Note possible differences compared to REBASE regarding the use of databanks and time periods.
You cannot use start/end dates with this function, only a single date (alternatively, use REBASE statement).
Returns: series. |
time 2020 2022; |
rename(x, cfg) |
For an array-series x: the function renames and reorders dimension elements, according to a cfg nested list (possibly as a listfile). The first column in such a listfile is the old dimension number, the second column is not used and functions only as a mnemotechnic helper label, the third column is the existing element name, and the fourth column is the new element name.
The order that the existing dimensions appear in, is reflected in the new dimension order. See example, where the old dimension 2 becomes the new dimension 1, the old dimension 3 becomes the new dimension 2, and the old dimension 1 becomes the new dimension 3. The column two labels can be anything: here dim1, dim2 and dim3 is used.
Note: with a cfg file like the following:
2; dim1;
only the dimensions are reordered without renaming. This can alternatively be done with the reorder() function: z = x.reorder((2, 3, 1));. |
//Given this listfile: |
reorder(x, ord) |
For array-series x, this function reorders the dimensions according to the list ord. The list must contain the integers 1..n, where n is the dimensionality of the array-series.
Note: for an array-series dimension of size n, if reorder() is fed with the list (1, 2, ... , n), the function returns an identical array-series. |
x = series(3); //has been moved to the last dimension of y, and //the other two dimensions are moved forwards. |
replace(x, v1, v2) |
For the series or array-series x, the function replaces the value v1 with the value v2, over the given sample.
See also iif(), isMiss(), and the $-conditional.
Returns: series
|
time 2001 2003; |
rotate(x, d) |
Transforms the array-series x to a new array-series, where the time dimension and dimension number d swap places.
For instance, the array-series pop may contain sub-series for each age group 0 to 100, that is, pop['0'], pop['1'], ... , pop[100']. These 101 sub-series are all defined over a time period, say 2020-2050. Then profile = rotate(pop, 1); will be a new array-series containing sub-series for each time period 2020 to 2050, that is, profile['2020'], profile['2021'], ... , profile['2050']. These 31 sub-series are all defined over an undated time period 0 to 100, corresponding to the age dimension. Hence, plot <0u 100u> profile['2020']; will plot the age profile of the population in the year 2020.
See example under PLOT (age profiles section). Returns: series |
//pop is a 1-dimensional array-series |
series(freq, n) |
Constructs a series or array-series of the given frequency and with the given dimensions (n). You can skip some of these options, see examples.
See also isArraySeries().
Returns: series
|
x = series('q', 3); //quarterly array-series, 3-dim |
setDomains(x, d) |
Uses a list of strings (d) to set the domains for each dimension of the array-series x. Use '*' to indicate a domain-less dimension (in GAMS called the universal set), but otherwise each element should start with symbol # (to indicate that it is a list). See also getFixType(), setFixType(), getDomains(). Returns: nothing |
#d = ('#b', '#x'); |
setFixType(x, type) |
Sets the "fix" type of an array-timeseries x, where type can be 'variable' or 'parameter'. When exporting an array-series to a GAMS gdx file, this difference is of significance. See also getFixType(), getDomains(), setDomains(). |
x = series(1); |
smooth(x) smooth(x, method) smooth(x, y) smooth(x, method, y) |
Function variant of the SMOOTH statement to fill holes (missing values) in the series x. Note possible differences compared to SMOOTH regarding the use of databanks and time periods.
Method must be 'linear', 'geometric', 'repeat', 'spline', or 'overlay'. If method is not stated, 'linear' is default. The y variable can be a series, value or 1x1 matrix (y is only used for 'overlay' smoothing).
Returns: series. |
z = x.smooth('linear'); //user linear smoothing |
splice(x1, x2, ...) splice(x1, t1, x2, ...) splice(x1, t1, t2, x2, ...) splice(type, x1, ...) |
Function variant of the SPLICE statement to splice two or more overlapping timeseries x1, x2, ... into one resulting timeseries. Note possible differences compared to SPLICE regarding the use of databanks and time periods.
Type can be 'rel1', 'rel2', 'rel3', 'abs' for the method, or 'first', 'last', '1', '2', '3', etc. for indicating the "primary" series number (such numbers must be strings). You may combine the method and "primary" indication with -, for instance 'rel3-first' or 'abs-2'. Default is 'rel1-last'. See many more details under SPLICE.
Returns: series. |
time 2001 2005;
//Regarding the left-hand side series, //note that splice() never inserts //So this time period is respected, //in contrast to the SPLICE statement.
|
subseries(x, option) |
Helper function for array-series x.
•option = 'elements': nested list of strings with element combinations for each sub-series. •option = 'names': list of sub-series names (as strings). You may remove the frequency part of these names with removefreq(), see example. •option = 'length': the number of sub-series inside the array-series. •option = 'dimensions': the number of dimensions of the array-series.
See also getelements(). |
x = series(2); prt x.subseries('dimensions'); |
timeless(freq, v) |
Constructs a timeless series of the given frequency freq, with value v. You can skip some of these options, see examples.
In many cases, you can just use a value scalar with the same functionality. But timeless series can be practical, for instance they can be used as array-series.
See also isTimelessSeries().
Returns: series
|
x = timeless('q', 3); //quarterly timeless series, with value = 3. |
Time, databank and other environment info
Function name |
Description |
Examples |
bankfilename(s) bankfilename(s, p) |
OBSOLETE: use fromBank(%s, 'filename') or fromBank(%s, 'fullpath'). |
|
bankname(i) |
Returns the name of the bank i (integer). The i integer designates the number in the databank list. You may use 'first' instead of 1. (Using 'ref' is also possible, but this will always return 'Ref'). Returns: string |
prt bankname(1);
prt bankname('first'); |
branch() |
Returns the name of the current Git branch as a string (may be empty if not found).
Starting from the Gekko working folder, Gekko looks for a folder containing a .git subfolder, searching upwards in the folder structure. If found, Gekko identifies the current branch name. For a tag checkout, the string 'tag: ...' is returned, and for a commit checkout, the string 'hash: ...' is returned. If no .git subfolder is found, an empty string is returned. NOTE: the .git folder must also be consistent with the folder where the running gcm file is residing, else an error is issued (change the working folder if this is an issue). This is to avoid confusion.
See also commit() and user(). |
tell branch(); |
commit() |
Returns the hash id of the current Git commit snapshot as a string (may be empty if not found). The string is 40 characters hex values from 0..9 or a..f. To truncate, use for instance commit()[1..8] to get the first 8 characters.
Starting from the Gekko working folder, Gekko looks for a folder containing a .git subfolder, searching upwards in the folder structure. If no .git subfolder is found, an empty string is returned. NOTE: the .git folder must also be consistent with the folder where the running gcm file is residing, else an error is issued (change the working folder if this is an issue). This is to avoid confusion.
See also branch() and user(). |
tell commit(); |
currentDateTime() |
Returns current date and time. Returns: string |
%s = currentDateTime(); |
currentDate() currentDate2() |
Returns current date, either as a string, or as a date with daily frequency. •currentDate() returns: string •currentDate2() returns: daily date. You may convert to other frequencies with the date() function, cf. examples. |
%s = currentDate(); |
currentDay() |
Returns the current day (between 1 and 31). Returns: val |
%v = currentDay(); |
currentFolder() currentFolder('rel') |
Returns the current working folder (cf. option folder working = ...). See also pathParts(). With 'rel' option, it returns the path relative to a root.ini file. Returns: string. |
%s = currentFolder(); |
currentFreq() |
Returns the current frequency, for instance a, q, m, w, d or u. Returns: string |
%s = currentFreq(); |
currentHour() |
Returns the current hour. Returns: val |
%v = currentHour(); |
currentMinute() |
Returns the current minute. Returns: val |
%v = currentMinute(); |
currentMonth() |
Returns the current month. Returns: val |
%v = currentMonth(); |
currentPerStart() |
Returns the start of the global time period. Returns: date |
%s = currentPerStart(); |
currentPerEnd() |
Returns the end of the global time period. Returns: date |
%s = currentPerStart(); |
currentSecond() |
Returns the current second. Returns: val |
%v = currentSecond(); |
currentTime() |
Returns current time. Returns: string |
%s = currentTime(); |
currentYear() |
Returns the current year. Returns: val |
%v = currentYear(); |
exist(s) |
Returns 1 if the variable corresponding to the string s exists, else 0. The input s must be of string type. For timeseries, you do not have to add frequency to the name (for instance !q), if the series is of current frequency. The function respects the option databank search setting (that is, in sim-mode it will only look in the first-position databank, if a databank name is not provided).
The exist() function can also check if an array-subseries exists, cf. example.
Returns: val |
x = 1; |
filteredperiods(d1, d2) |
Returns the number of filtered periods between d1 and d2 (two dates). Returns: val |
%v = filteredperiods(%d1, %d2); |
fromBank(x, type) |
Accesses meta-information from the databank x (string). Type (string) can be:
•'filename' (only file, returns string) •'fullpath' (file and path, returns string) •'label' (cf. HDG, returns string) •'stamp' (last time written, returns string) •'stamp2' (last time written, returns daily date) •'format' (returns '1.0', '1.1' or '1.2'). •'count' (number of variables, returns val) |
prt fromBank('bank1', 'filename'); prt fromBank('Work', 'count'); |
fromSeries(x, type) |
Accesses meta-information from the timeseries x. Type can be
•'name' (returns string) •'bank' (returns string) •'freq' (returns string) •'label' (returns string) •'source' (returns string) •'unit' or 'units' (returns string) •'stamp' (returns string) •'stamp2' (returns date) •'dataStart' or 'dataEnd' (returns date: period with actual data). See also isMiss() and allMiss(). •'dataStartTruncate' or 'dataEndTruncate' (returns date: period with actual data, truncated with global or local time period). May return null/empty.
The x argument can be either a series name or string. |
%s = ref:gdp.fromSeries('label');
|
gekkoBitness() |
Returns bitness of Gekko (either '32' or '64'). Returns: string. |
tell 'Gekko {gekkoVersion()} ({gekkoBitness()}-bit)'; |
gekkoInfo(x) |
Returns a string with info on Gekko. Choose between the following regarding x:
•'short1' = Gekko-version •'short2' = Gekko-version + bitness •'short3' = Gekko-version + bitness + period •'short4' = Gekko-version + bitness + working folder •'short5' = Gekko-version + bitness + period + working folder
Returns: string. |
tell gekkoInfo('short1');
|
gekkoVersion() |
Returns the Gekko version number ('xx.yy.zz'). See also gekkoVersionDate(). Returns: string |
tell 'Gekko ' + gekkoVersion(); |
gekkoVersionDate() |
Returns the daily date corresponding to the Gekko.exe file of the currently executing Gekko. Beware the file systems, version control systems, etc. may tamper with file dates (like the date of Gekko.exe). See also gekkoVersion(). Returns: daily date |
tell 'Gekko ' + gekkoVersion() + ' ' + gekkoVersionDate(); |
getEndoExo() |
Returns a list with names of those variables that start with 'endo_' or 'exo_'. This is used with GAMS models, when fixing equations. Returns: list of strings. |
#m = getEndoExo(); |
isLibraryLoaded(x) |
Returns 1 if the library with the name x (a string) is loaded, and 0 otherwise. Returns: val |
%v = islibraryloaded('lib1'); |
isOpen(x) |
Returns 1 if the databank with the name x (a string) is open, and 0 otherwise. Returns: val
|
%v = isopen('mybank'); |
pathParts(x) |
Finds the parts of a string path, returned as a list of strings. For instance 'c:\xx\yy\zz.txt' will return the list ('c:', 'xx', 'yy', 'zz.txt'). The function handles both '\' and '/', relative paths, and UNC paths.
You may use reverse() to reverse the order of the parts. See also root(), runFolder(), currentFolder(), path(). |
#path1 = pathParts('c:\xx\yy\zz.txt'); |
root() root('root') root('gekko') |
Returns the name of a root folder as a string path (without any closing backslash), searching upwards from the working folder. The call root() or root('root') will look for a file root.ini, and root('gekko') will look for a file gekko.ini.
To find the root directory, Gekko first looks for a root.ini/gekko.ini file in the working folder. If not found, Gekko looks in the parent folder of the working folder, and so on upwards.
If no file or more than one file is found, Gekko aborts with an error. NOTE: the root.ini/gekko.ini file must also be consistent with the folder where the running gcm file is residing, else an error is issued (change the working folder if this is an issue). This is to avoid confusion.
Using root() makes it easier to refer to files inside a larger folder structure, without hard-coding folder names. See also rootify() and pathParts(). |
open g:\update\data\scenario5\bank; //hard-coded root // In the latter OPEN, it is presupposed that the // folder g:\update contains a file with the // name root.ini. The contents of this file has // no significance, but could contain a remark that // the file should not be deleted or moved. // If the system of folders inside g:\update is // later on moved to a new location, for instance // to g:\update2, the latter OPEN statement still works // in the new location. // You could alternatively use relative paths to // the same effect, but then you would have to use // paths like open ..\..\..\data\scenario5\bank;.
//To use a gekko.ini file instead of //root.ini as root, use: open {root('gekko')}\data\scenario5\bank;
//The contents of a root.ini file could be for instance: // Do not delete or move. Used by the Gekko root() // function to provide an "anchor" for relative paths.
tell root(); //to see what the current root is
|
rootify(folder, rootpath) |
This function is a convenience function to be used to replace path names with {root()} in a sysem of .gcm files. This can be useful if you are using a system with a lot of hardcoded paths that you want to make easier to copy or move. The folder argument designates the folder (including subfolders) for which rootify() is done. The rootpath argument is the path you want to have replaced with {root()}.
Note: rootify only touches files in the folder folder and subfolderes, and does not touch anything in the rootpath folder (unless, of course, there is overlap between folder and rootpath).
For textfiles other than .gcm Gekko will also look at these and report if any contain the rootpath. Gekko will not alter file dates in rootify().
See also root(). |
//Example: consider a gcm file residing in the folder //g:\common\data: //the file looks like this: |
runFolder() runFolder('rel') |
Returns the folder name (string) corresponding to the currently executing .gcm file (without any closing backslash).
With 'rel' argument, the difference between runFolder() and root() is returned. For instance, with a root in c:\data\root.ini and an executing .gcm file c:\data\source\progs\gdp.gcm, runFolder('rel') will return 'source\progs', note the absence of beginning of closing backslashes.
See also pathParts(). |
write <csv> k:\common\{runFolder('rel')}\gdp.csv; //c:\data\root.ini, the relative path is //source\progs, which is "glued" onto k:\common, //so that the file will be written to //k:\common\source\progs\gdp.csv.
%parent = runFolder().pathParts().reverse()[2]; //Returns the name of the parent folder //of the currently running .gcm file. //pathParts() chops the path up after '\' or '/' //reverse() reverses the parts. //[2] picks the second one. |
time() time(<t1 t2>) |
Returns the current time period as a series where the dates are represented as values. Works with quarters and months, too. The function may for instance be practical for creating trend variables.
Note: if you need a quarterly or monthly time() to average-collapse into an annual time(), you should use time()-0.5.
Returns: series |
option freq q; |
user() |
Returns the user's logon name (if any): you may also think of this as the user ID. In companies, this is often the same as user's email address, like js for the employee John Smith with email address js@company.com. |
prt user(); |
userDomain() |
Returns the user's domain name. This is not necessarily very informative, in contrast to user(). |
prt userDomain(); |
Matrix functions:
Function name |
Description |
Examples |
avgc(x) |
Average over cols for the matrix x. Returns: matrix |
#m2 = avgc(#m1); |
avgr(x) |
Average over rows for the matrix x. Returns: matrix |
#m2 = avgr(#m1); |
chol(x) chol(x, type) |
Cholesky decomposition of matrix x. Accepts type (string), either 'upper' or 'lower'. Returns: matrix |
#m2 = chol(#m1, 'upper'); |
cols(x) |
Returns the number of colums of the matrix x. Returns: val |
%v = cols(#m); |
design(x) |
Returns a "design" matrix given the input matrix x, equivalent to the same Gauss function. The function is practical for aggregating rows or columns.
Input: is a n x 1 column matrix. Returns: n x k matrix of 0's and 1's. The input numbers specify the columns in which the 1's should be placed.
In the example, a 4 x 5 matrix #x of 1's is defined, and by means of the aggregation matrix #m, it is aggregated from size 4 x 5 to 4 x 3. In this case, the new column 1 is the old columns 2 and 3, the new column 2 is the old column 5, and the new column 3 is the old columns 1 and 4. |
#a = [3; 1; 1; 3; 2]; |
det(x) |
Determinant of a matrix x. Returns: val |
%v = det(#m); |
diag(x) |
Diagonal. If x is a n x n symmetric matrix, the method returns the diagonal as a n x 1 matrix. If x is a n x 1 column vector, the method returns a n x n matrix with this column vector on the diagonal (and zeroes elsewhere). Returns: matrix |
#m2 = diag(#m1); |
divide(x1, x2) |
Element by element division of the two matrices x1 and x2. If x2 is a row vector, each x1 column will be divided with the corresponding value from the row vector. And if x2 is a column vector, each x1 row will be divided with the corresponding value from the column vector. Returns: matrix |
#x = divide(#x1, #x2); |
i(n) |
Returns a n x n identity matrix. Returns: matrix |
#m = i(10); |
inv(x) |
Inverse of matrix x. Returns: matrix |
#m2 = inv(#m1); |
maxc(x) |
Max over cols of matrix x. Returns: matrix |
#m2 = maxc(#m1); |
maxr(x) |
Max over rows of matrix x. Returns: matrix |
#m2 = maxr(#m1); |
minc(x) |
Min over cols of matrix x. Returns: matrix |
#m2 = minc(#m1); |
minr(x) |
Min over rows of matrix x. Returns: matrix |
#m2 = minr(#m1); |
m(n, k) or miss(n, k) |
Returns a n x k matrix filled with missing values. Cf. also m() function for values. Returns: matrix |
#m = m(5, 10); |
multiply(x1, x2) |
Element by element multiplication of the two matrices x1 and x2. If x2 is a row vector, each x1 column will be multiplied with the corresponding value from the row vector. And if x2 is a column vector, each x1 row will be multiplied with the corresponding value from the column vector. Returns: matrix |
#x = multiply(#x1, #x2); |
ones(n, k) |
Returns a n x k matrix filled with 1's Returns: matrix |
#m = ones(5, 10); |
pack(v1, v2, ...) pack(<t1 t2>, v1, v2, ...) |
Using period t1 to t2, the timeseries v1, v2, ... are packed into a n x k matrix, where n is the number of observations and k is the number of variables. If the period is omitted, the global time period is used. Returns: matrix |
#m = pack(<2020 2030>, x, y, z); Returns: a 11 x 3 matrix #m with the values. |
rows(x) |
Returns the number of rows of the matrix x. Returns: val |
%v = rows(#m); |
sumc(x) |
Sum over cols of the matrix x. Returns: matrix |
#m2 = sumc(#m1); |
sumr(x) |
Sum over rows of the matrix x. Returns: matrix |
#m2 = sumr(#m1); |
t(x) |
Returns the transpose of a matrix x. Returns: matrix |
#m2 = t(#m1); |
trace(x) |
Returns the trace of a matrix x. (This does not have anything to do with data-traces). Returns: val |
%v = trace(#m); |
unpack(m) unpack(<t1 t2>, m) |
The column matrix m (with only one column) is unpacked into a timeseries spanning the period t1 to t2. If the period is omitted, the local/global time period is used. The unpack() function is not strictly necessary: you may alternatively assign a n x 1 matrix directly to a series (see example). Returns: series |
//This picks out the second column of #m (and all the rows). y = #m[.., 2].unpack(<2020 2030>); |
zeros(n, k) zeroes(n, k) |
Returns a n x k matrix filled with 0's. Zeroes() can be used as alias. Returns: matrix |
#m = zeros(5, 10); |
Modelling
Function name |
Description |
Examples |
modelRawEqs() |
Returns a list of strings corresponding to the equation names used by the loaded raw GAMS model. Note: the so-called GAMS scalar model is not used in this function.
Returns: list of strings. |
model <gms> mymodel.zip; |
modelRawVars() |
Returns a list of strings corresponding to the variable names used by the loaded raw GAMS model. Note: the so-called GAMS scalar model is not used in this function.
Returns: list of strings. |
#vars = modelRawVars(); |
modelScalarEqs() |
Returns a list of strings corresponding to the equation names used by the loaded GAMS scalar model.
Returns: list of strings. |
|
modelScalarVars() |
Returns a list of strings corresponding to the variable names used by the loaded GAMS scalar model.
Returns: list of strings. |
|
Data-trace handling:
Function name |
Description |
Examples |
||
fromTrace(x, type) |
Extracts trace information from a timeseries x as a list, with one list element for each data-trace (newest first). Type can be:
•'id'. ID's as strings. •'stamp2'. Stamps as Gekko daily dates. •'name'. Variable names (left-hand side) as strings. •'code'. Gekko statements as strings. •'period'. Periods as a nested list of dates. •'active'. Active periods as a nested list of date spans. •'file'. A list of file names and line numbers. •'datafile'. A list of datafiles used. •'vars'. A nested list of variable names used.
Note: only direct traces are returned, not nested traces. |
reset; time 2020 2025; |
||
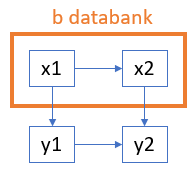
traceBank(b, type) traceBank(x, b, type) |
After a databank containing traces is read/opened, the traceBank() function can find data connections between variables. Arguments are x for the Gekko (array-)timeseries, b is a string containing a databank name, and type is either 'precedents', 'precedents1' , 'dependents' or 'dependents1'. The x argument may be a string like 'x[a]!q' or a series object like x[a]!q. You may call the function without the x argument: in that case, all series names are considered.
Note: for 'dependents' type, it is recommended that x is a string name rather than a series object (because the series object may not even exist).
The options 'precedents1' and 'dependents1' limits the effects to direct effects only. For instance, in the example, y2 directly depends upon x1 from the b databank, but not directly upon x2.
Note: you may remove frequencies from the list elements with for instance tracebank('y2', 'b', 'precedents').removefreq(). |
open<edit>b; clear b; prt tracebank('y2', 'b', 'precedents1'); prt tracebank('x1', 'b', 'dependents1'); //'x1!a', 'x2!a' //'x2!a' //'y1!a', 'y2!a' //'y1!a'
//The series x1 and x2 reside in the b databank, //where x2 depends upon x1. The series y1 depends //upon b:x1, and the series y2 depends upon y1 //and b:x2. The first tracebank() call shows that //y2 depends upon both b:x1 and b:x2, the former //of these indirectly via x2. The third //tracebank() shows that b:x1 affects both y1 and //y2, the latter of these indirectly via both y1 //and b:x2. |
||
traceBanks(m) traceBanks(m, direct, freq) |
For a first-position Gekko-databank with data-traces, this function finds precedents (cf. the traceBank() function), and for each precedent, the function shows its dependents. The first argument is a list of databank names to look for in the data-traces, for instance the list ('b1', 'b2'). In that case, the function loops over 'b1' and 'b2', let us start out considering 'b1'. The function looks for all occurrences of b1: in the data-traces, and each occurrence gets a line in the output file tracebanks_b1.txt. Given series statements like y = b1:x1; z = 1/b1:x1; the output file could have a line like:
x1 y, z
meaning that x1 from the b1 databank is used, and it is used to determine y and z from the first-position Gekko databank.
You may set the second argument to 1 to get direct effects only, and the third argument to 1 to include frequencies, like x1!a. Cf. also prt tracebank('b1', 'precedents');, which will print names corresponding to the first column in tracebanks_b1.txt. |
traceBanks(('b1', 'b2')); |
||
traceDelete() traceDelete(x) |
Deletes all trace references in the first-position databank (or use x for an optional databank name). After this, a traceStats() will show 0 traces. |
tracedelete(); |
||
traceStats() traceStats(x) |
For now, this function is only a simple overview of the number of traces (x is an optional databank name). Depth = 0 means traces that are directly assigned to existing timeseries, whereas depth = n > 0 indicate traces that are not assigned to existing timeseries, but are instead assigned to other traces with depth = n-1. Traces with depth > 0 can be thought of as remnants of timeseries that do not (or do no longer) exist in the particular databank. |
tracestats(); |
Miscellaneous functions:
Function name |
Description |
Examples |
compareFolders(f1, f2) compareFolders(f1, f2, filter) compareFolders(f1, f2, filter, options) |
The function compares two folders f1 and f2 (including subfolders), a bit like COMPARE for databanks.
With default settings, two files with the same name, in the same subfolder, with same size, and with same date (within 2 seconds) are considered equal. If dates differ, the files are compared by contents: byte for byte for binary files, and line for line for text files (differing whitespace at the start or end of a single text line will not count as a difference). The function outputs three files: comparefolders.txt with file info, comparefolders1.zip with differing common text files for easy comparison, and comparefolders2.zip with Gekko code to update folders f1 or f2.
You may use a wildcard filter like for instance '*.gcm, !*_bak.gcm', which means all .gcm files except those ending with _bak (use prefix ! for patterns to omit). The last argument options can be 'text' if you only want to compare text files (Gekko 'tastes' the files to see if they are binary or text), and/or 'strict' to always compare files by content. Instead of 'strict' you may use 'date' to make Gekko only look at files dates for comparisons, ignoring file contents (use this on a copy of a folder to see which files a given program 'touches').
Note that in comparefolders1.zip, folder delimiters are represented as --, and extension dot is represented as ,. Sort the files by name when opening the .zip. You may drag and drop a folder from a file manager like Total Commander into the Gekko input window, to paste the folder path as a string. Total Commander is also convenient for comparing the files in comparefolders1.zip. |
comparefolders('c:\update\newdata', 'c:\update\olddata'); comparefolders('c:\update\newdata', 'c:\update\olddata', '*.gcm, !*_bak.gcm'); comparefolders('c:\update\newdata', 'c:\update\olddata', '', 'text strict'); comparefolders('c:\update\newdata', 'c:\update\olddata', '', 'date'); |
deleteFile(x) |
Given a full absolute path (with drive letter) pointing to a file, Gekko will try to delete this file. Full path is required for safety purposes. See also existFile(), existFolder(), getFiles(), getFolders(), readFile() and writeFile(). [New in Gekko 3.3.3] |
deletefile('c:\data\scenario5.gbk'); |
existFile(x) |
Returns value 1 if the file x exists, 0 otherwise. If the file is stated without path, Gekko will also look in loaded libraries for it. See also existFile(), existFolder(), getFiles(), getFolders(), readFile() and writeFile(). |
if(existfile('c:\data\scenario5.gbk')); |
existFolder(x) |
Returns value 1 if the folder x exists, 0 otherwise. See also existFolder(), getFiles(), getFolders(), readFile() and writeFile(). |
if(existfolder('c:\data')); |
flush() |
Removes all cache files (can also be done from the Gekko menu File --> Delete cache files...). This forces Gekko to re-read datafiles and models rather than using cached versions. At start up, Gekko performs flushing automatically every 14 days, or when the cache files take up more than 50 GB of file space.
The function is intended for occasional manual use, and Gekko will refuse using it from a Gekko program. Using it too often will just slow down reading datafiles and models. |
flush(); |
getFiles(x) |
Given a full absolute path to a folder, Gekko returns a list of the file names found in that folder. See also deleteFile(), existFile(), existFolder(), getFolders(), readFile() and writeFile(). Returns: list. [New in Gekko 3.3.3] |
prt getfiles('c:\data'); |
getFolders(x) |
Given a full absolute path to a folder, Gekko returns a list of the folder names found in that folder. See also deleteFile(), existFile(), existFolder(), getFiles(), readFile() and writeFile(). Returns: list. [New in Gekko 3.3.3] |
prt getfolders('c:\data'); |
isNull(x) |
Returns value 1 if x is a null variable, 0 otherwise. See also null(). |
#m = ((1, 2, 3), (4, null(), 6)); |
isUtf8File(x) |
Check if the text file x (string path) seems to be in UTF-8 format or not (if not, the format may be ANSI). If the file is stated without path, Gekko will also look in loaded libraries for it. See also existFile(), readFile() and writeFile(). Returns: value 0 or 1. |
%b = isUtf8File('rawdata.txt'); //'option system write encoding = ...' |
lhsRhs(file) lhsRhs(file, version) |
Experimental function that analyzes a Gekko .gcm file syntactically and returns lists of timeseries names that appear on left-hand or right-hand sides of assignments ("series statements"). Input is file (string) and version (value) -- value must be 2 (Gekko 2) or 3 (Gekko 3), default is 3. |
lhsRhs('data.gcm'); |
map() |
Returns an empty map. |
#m = map(); |
null() |
Returns a null variable. At the moment, null variables are mostly used to indicate empty "cells" in lists. You cannot perform calculations on null variables, but you can use the type() function to see the type of a given variable/cell (see example). See also isNull(). Returns: null variable |
#m = ((1, 2, 3), (4, null(), 6)); |
readFile(x) |
Reads the file x (string path) into a string. If the file is stated without path, Gekko will also look in loaded libraries for it. See also deleteFile(), existFile(), existFolder(), getFiles(), getFolders() and writeFile(). Returns: string |
%s = readFile('rawdata.txt');
//See also 'option system encoding ...' |
readScreen() |
Reads the Gekko output screen (the upper part of the Gekko graphical user interface) into a string. See also readFile(). You may use the split() and nl() functions to split the string into lines. Returns: string |
#m = readscreen().split(nl(), 0); //makes sure empty lines are retained. |
tic() |
Starts a timer, see toc(). Used to time Gekko programs. |
tic(); |
toc() |
Returns the number of seconds elapsed since a timer was started with tic(). Used to time Gekko programs. |
tic(); |
type(x) |
Returns the type of a given variable x. The type is 'val', 'date', 'string', 'series', 'list', 'map', 'matrix' or 'null'. See examples. At the moment, null variables are mostly used to indicate empty "cells" in lists. Returns: string |
#m = (1, 2021, 2021a, 'cat', null()); |
writeFile(x, s) |
Writes the string s to the file x (string path). See also deleteFile(), existFile(), existFolder(), getFiles(), getFolders() and readFile(). |
writeFile('rawdata.txt', '170 121 387');
//See also 'option system encoding ...' |
yesno(x) |
Converts value 1 or 0 into the string 'yes' or 'no'. Quite a lot of options accept yes/no, but not 1/0. |
tell existfile('c:\data\scenario5.gbk').yesno();
|