|
<< Click to Display Table of Contents >> PLOT |
  
|
|
<< Click to Display Table of Contents >> PLOT |
|
The PLOT statement plots series expressions, optionally using so-called operators like d, p, m, q, etc. Mixed frequencies and array-series are supported, and there are many layout possibilities: see the demo plots. Layout options can be stated in the PLOT statement itself, or stored in a .gpt schema file (for reuse of styling). Note that PLOT, SHEET and CLIP have the same syntax, so you can always change PRT into PLOT/SHEET/CLIP.
Guide: plotting For an easier introductory guide on Gekko plotting, see this page. |
Besides simple syntax like plot x1, x2; to plot two timeseries x1 and x2, you may use a list of names #i like plot x{#i};, or you may use wildcards like plot {'x*'};. For an array-series x, plot x; will plot all its elements (sub-series), but the sub-series can also be unfolded by means of lists, for instance plot x[#i,#j]; or a single sub-series: plot x[a,b];.
Note that a bankless variable x in plot x; may be searched for in other databanks than the first-position databank, cf. the databank search page. Use for instance b1:x; to make sure x is from the b1 databank, and use @x (or ref:x) to access x from the Ref databank. You may also use <bank=...> to designate the databank (<ref=...> to designate the Ref (reference) databank).
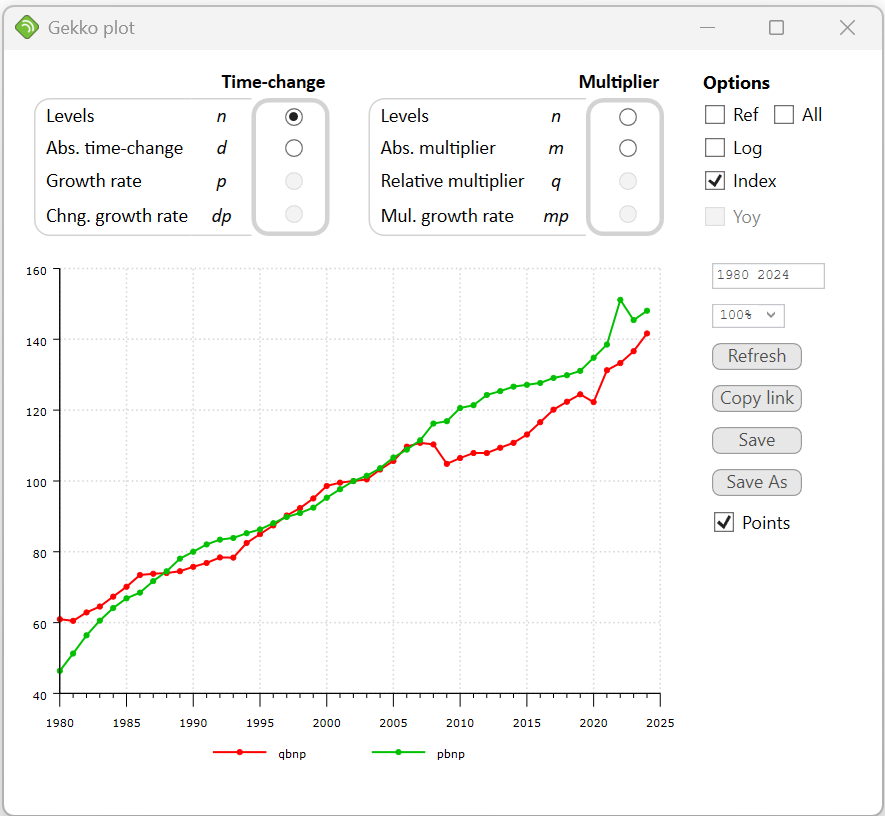
In the PLOT window, you may choose operators in a layout similar to the DECOMP window. Besides these radio buttons, you may choose Ref for series in the Ref databank, All to show at the same time series from the first-position and Ref databanks, Log to log-transform the input data, Index to index transform the input data (setting index = 100 in the start of the period), YoY to show year-over-year changes for quarterly or monthly data. In addition, you may choose the time period, the zoom level of the graph, and there are buttons to refresh, copy and save the graph (save as .svg, .emf, .png or .pdf file). Finally, there is a checkbox to select/unselect point markers on the graph lines (the small circles).
PLOT uses the same internal component as PRT, so regarding operators and other details, also see the PRT help page.
You may use <bank=... ref=...> to locally change the databanks used for the operators.
Gekko uses gnuplot 5.1 internally for plotting. The gnuplot engine may crash if fed with illegal syntax or nonsensical data. You may use plot<dump> and feed the gnuplot.gp file into gnuplot 5.1 to inspect error messages. |
Syntax
plot <period operator PLOTCODE=... DUMP NOMAX mainOptions BANK=... REF=... MISSING=... LABEL=...> elements USING=... FILE=... ;
elements: element1, element2, ...
element: expression label <elementOptions>
•If no period is given inside the <...> angle brackets, the global period is used (cf. TIME).
•If a variable without databank indication is not found in the first-position databank, Gekko will look for it in other open databanks if databank search is active (cf. MODE).
The more general options shown above are the following (cf. the 'Main options' table below for all the plot-related options):
period |
(Optional). Local period, for instance 2010 2020, 2010q1 2020q4 or %per1 %per2+1. |
operator |
(Optional). 'Long': abs, dif, pch, gdif, or 'short': n, d, p, dp, m, q, mp, l, dl, r, rd, rp, rdp, rl, rdl, a, ad, an, ap, adp, al, adl, i. Read more about operators under PRT. |
variables |
Name of the variable(s) printed. Several variables can be printed at once using var1, var2, var3, .... You may also use lists or expressions. Labels may be provided with <label>, or with plot x 'Production'; , or plot x x.fromseries('label'); to use label metadata. |
PLOTCODE= |
(Optional). The contents of this string must be gnuplot code (for instance 'set' statements separated by semicolon), and the contents is sent to gnuplot and inserted just before the gnuplot 'plot' statement. If plotcode is also stated in the .gpt schema file, both plotcodes are transferred to gnuplot (first the .gpt plotcode, and then the local option plotcode). |
DUMP |
(Optional). With option <dump>, Gekko will put two gnuplot files in the working folder: gnuplot.gp (the gnuplot script), and gnuplot.data (the gnuplot data). The gnuplot script can be run inside gnuplot 5.1 with the following statement: load 'gnuplot.gp' (note the quotes). |
NOMAX |
(Optional). Do not restrict the number of curves, cf. option plot elements max. |
BANK |
(Optional). A bankname where variables are looked up. For instance plot <bank = b1> x; is equivalent to plot b1:x;. See also <ref = ...>. These options can be convenient instead of opening and closing banks. |
REF |
(Optional). A bankname where Ref (reference) variables are looked up. For instance plot <bank = b1 ref = b2 m> x; uses banks b1 and b2 for the multiplier. See also <bank = ...>. These options can be convenient instead of opening and closing banks |
MISSING= |
(Optional). With <missing = ignore>, PLOT will deal with missing array sub-series and missing data values like GAMS, treating them as zero for sums and mathematical expressions, or skipping the printing of a sub-series if it does not exist. The following options are set locally and reverted afterwards: option series array print missing = skip; option series array calc missing = zero; option series data missing = zero. See also the appendix page on missings. |
LABEL |
(Optional). <label> is the same as <meta=l>, showing labels. See the <meta> option. |
META= |
(Optional). With <meta=...>, Gekko can show series meta information instead of series names. You can choose between n (name), l (label), s (source), u (unit), and p (stamp), for instance <meta=ls> to show label and source, or <meta=ln> to show label and name.
<meta=...> will work for lists of names like plot <meta=ls> {#m};. Using for instance plot <meta=l> x; is easier than the more cumbersome plot x x.fromseries('label');. Remember that labels from an external file or model file can be loaded with doc<varlist>). |
USING= |
(Optional). Indicates a .gpt file (xml template) to style your plot. You may use * as filename to select from .gpt files in the working folder. If no extension is provided, .gpt is added automatically. See also option plot using = ... . Filenames may contain an absolute path like c:\projects\gekko\bank.gbk, or a relative path \gekko\bank.gbk. Filenames containing blanks and special characters should be put inside quotes. Regarding reading of files, files in libraries can be referred to with colon (for instance lib1:bank.gbk), and "zip paths" are allowed too (for instance c:\projects\data.zip\bank.gbk). See more on filenames here. |
FILE= |
(Optional). Use extension svg (default), emf, parquet, pdf, png. The resulting file is in .svg format as default. Such a file can be imported into many Windows programs such as Word and others. You may use a filename with explicit extension .emf/.parquet/.pdf/.png instead, and PLOT will produce the file in that format. The .svg files are very useful for insertion into a html document. Filenames may contain an absolute path like c:\projects\gekko\bank.gbk, or a relative path \gekko\bank.gbk. Filenames containing blanks and special characters should be put inside quotes. Regarding reading of files, files in libraries can be referred to with colon (for instance lib1:bank.gbk), and "zip paths" are allowed too (for instance c:\projects\data.zip\bank.gbk). See more on filenames here.
|
You may use an operator to indicate which kind of data transformation you would like on your variables, for instance plot<d> or plot<q>. As in the PRT statement, you may also use element-specific operators (for instance plot unemp, gdp<p>;). See the PRT statement regarding the use of operators.
In addition to the above options, you may put graph-options inside either the main option field (plot <...>), or inside the element option fields (plot x1<...>, x2<...>). These options can alternatively be stored in an external xml-based .gpt file, for instance plot x1, x2 using=p; will use the file p.gpt to style the graph. The structure of the .gpt file corresponds to the distinction between PLOT main options and element options. Cf. the example section below.
Main options
Located inside the plot<...> option field, or in .gpt files directly inside the <gekkoplot> tag. The first column of the table is before the =, and the second column of the table is after, for instance plot <type = linespoints>;. Some of the right-hand side expressions may require quotes around them, for instance plot<font = 'Verdana'>;, not plot<font = Verdana>;. If in doubt, try using quotes.
type |
The most used of the following are the line-types linespoints and lines, together with boxes (column chart).
•linespoints, lines: Normal lines, with or without point markers. •boxes: bar chart/histogram. If several timeseries are boxes, these will be clustered, unless the stacked option is set. •filledcurves: lines where the area below each line is an area. If the stacked option is set, the areas are stacked instead of overlayed. •steps: Step-wise lines, a bit box-like. •points: Just the point markers, no lines. •dots: Just tiny dots. •impulses: vertical lines instead of boxes.
Quotes may be omitted. |
dashtype |
'1':normal, '2':dashed, '3':dotted, ... (default: '1'). More. Quotes should be used. |
linewidth |
A number. Default: 3. |
linecolor |
You may use named colors (for instance 'red') or color codes known from html (for instance '#0000FF'). Default: color is taken from the palette setting. Quotes should be used. |
pointtype |
An integer. These points are shown for each period, if the linetype is linespoints or points.
•1:'+' •2:'x' •3:'*' •4:box •... etc.
Default: 7 (circle). More. |
pointsize |
A number. The size of the points. Default: 0.5. |
fillstyle |
String. Only relevant for linetype boxes. You may use many combinations, for instance 'empty', 'solid', 'solid 0.5' (50% transparent), 'solid border', 'pattern 0', 'pattern 1', etc. To provide a black border around the boxes, use for instance 'solid 1.0 border linetype -1'. Default: 'solid'. More. Quotes should be used. |
title |
The title of the entire plot. Quotes should be used. |
subtitle |
A subtitle underneath the title. Quotes should be used. |
font |
Set for instance 'Verdana', 'Arial', 'Times', 'Courier New' ... . Default is 'Verdana'. Quotes should be used. |
fontsize |
Default is 12. |
bold |
Use this option to indicate bold font type for different elements. Choose from 'title', 'ytitle', 'xtics', 'ytics', 'key', or indicate several of these separated with commas, for instance 'title, ytitle, key'. Quotes should be used. |
italic |
Use this option to indicate italic font type for different elements. Choose from 'title', 'ytitle', 'xtics', 'ytics', 'key', or indicate several of these separated with commas, for instance 'title, ytitle, key'. Quotes should be used. |
tics |
You may choose between 'in' or 'out'. Default: 'out'. Quotes should be used. Regarding number formatting, see option plot decimalseparator = .... |
grid |
Choose between yes|no|xline|yline. If yes, both vertical and horizontal lines are shown. If xline, only vertical lines are shown. If yline, only horizontal lines are shown. Default: yes. Quotes can be omitted. |
gridstyle |
This sets how gridlines are formatted, stated in gnuplot syntax. Quotes should be used.
•Default is the following, which are light grey dashed lines: 'linecolor rgb "#d3d3d3" dashtype 3 linewidth 1.5'. •The gridstyle 'linecolor black dashtype 2 linewidth 2.0' will provide black dashed lines which look ok in Word. •To emulate the solid grey style of Gekko 2.2.4 and earlier, use 'linecolor rgb "#f0f0f0" linetype 1 linewidth 1'.
In general, the same dashed lines can look quite different in different "environments". So there may be differences in the Gekko window versus inside Word versus pdf (exported from Word) versus html (via svg) versus pdf (exported from html) versus printed from Word or a browser. In general, there will be small differences between the .svg, .emf, .png and .pdf files. For html pages, please use .svg instead of .png for better quality. |
key |
In gnuplot, the legend is called 'key'. This sets how the legend is to be displayed, stated in gnuplot syntax. Default is the following, which is outside of the plot area, at the bottom center: 'out horiz bot center Left reverse'. Quotes should be used.
To remove the key completely, you can use gnuplot-code 'set key off': plot<plotcode='set key off'>;. |
palette |
You may use a comma-separated list of named colors (for instance: 'red, blue, green', or rgb color codes (like '#0000FF, #FFFF00, #00FFFF'). Default is this: 'red, web-green, web-blue, orange, dark-blue, magenta, brown4, dark-violet, grey50, black' (these are gnuplot internal color names). Quotes should be used. More. |
stack |
If the element is set active (<stack>), boxes are stacked instead of clustered, and filledcurves are stacked instead of overlayed. Default: no. |
boxwidth |
The width of the boxes. Set to 1 for max width. Default: 0.75. |
boxgap |
The gap between clusters of boxes (only relevant if you are using two or more boxes at the same time). Default: 2, that is, a gap of what two boxes would fill. |
separate |
With the separate option, lines and boxes are separated, so that all lines (non-boxes) are shown at the top of the plot (with labels on the left y axis), whereas all boxes are shown at the bottom of the plot (with labels on the right y2 axis). For instance, this is practical for residual plots, so that the residuals do not interfere with observed/fitted lines. The option will override any y2 options regarding the lines. This functionality is Gekko-specific and does not yet work for stacked boxes (option boxstack), where the scaling will not be precise (this will be fixed in a future version). Default: no. |
xline |
Vertical line at the given period. Several lines may be given. For instance: <xline>2020q2</xline>. |
xlinebefore |
Vertical line between the given period and the period before. Several lines may be given. For instance: <xlinebefore>2020q2</xlinebefore>. |
xlineafter |
Vertical line between the given period and the period after. Several lines may be given. <xlineafter>2020q2</xlineafter> |
xzeroaxis x2zeroaxis |
The xzeroaxis is the horiontal axis corresponding to y=0, and the x2zeroaxis is the axis corresponding to y2=0 (the right-hand side y-axis). These xzeroaxes will only be shown if the y or y2 values change sign. Default for xzeroaxis is yes, and default for x2zeroaxis is no. |
ymirror |
Mirror the left y axis on the right side. You may choose between '0':none, '1':only tics, '2':tics with labels, and '3': tics with labels + axis label. If the y2 axis is used, the ymirror setting is ignored. |
ytitle y2title |
A title for the y or y2 axis. Quotes should be used. If the title should break, you may use a \n, for instance plot<ytitle='Balance\nof payments'>;. |
yline y2line |
Horizontal line at the given y- or y2-value. Several lines may be given. For instance: <yline>150</yline>. The lines are not shown if the lines are outside of the y values of the variables shown in the graph (you may combined with ymaxsoft/yminsoft).
You may alternatively do horizontal lines manually, for instance: plot 150 '' <type=lines dashtype='3' linecolor='gray'>, x1, x2, x3;. The quotes '' after 150 indicated that the label is skipped. Putting the line first means that it will appear in the background (looks better for type=boxes).
|
ymax y2max |
Fixed max for the y or y2 values. Will overrule any maxhard or maxsoft values. Can cut off data points. |
ymaxhard y2maxhard |
All values > maxhard are filtered out, but all values < maxhard are shown. This setting is practical for filtering out outliers. Think of 'hard' as being capable of cutting off data points. |
ymaxsoft y2maxsoft |
All values are shown, but the axis will not scale down below ymaxsoft. This keeps a sensible scale, even if the y or y2 values are very small. Think of 'soft' as being incapable of cutting off any data points. |
ymin y2min |
Fixed min for the y or y2 values. Will overrule any minhard or minsoft values. Can cut off data points. |
yminhard y2minhard |
All values < minhard are filtered out, but all values > minhard are shown.This setting is practical for filtering out outliers. Think of 'hard' as being capable of cutting off data points. |
yminsoft y2minsoft |
All values are shown, but the axis will not scale up above yminsoft. This keeps a sensible scale, even if the y or y2 values are very small. Think of 'soft' as being incapable of cutting off any data points. |
plotcode |
The contents of this <plotcode> tag must be gnuplot code (for instance 'set' statements separated by semicolon), and the contents is sent to gnuplot and inserted just before the gnuplot 'plot' statement. If plotcode is also stated as a local option to the PLOT statement, both plotcodes are transferred to gnuplot (first the .gpt plotcode, and then the local option plotcode). |
Element options
Located in the element options, for instance plot x1<...>, x2<...>, or in .gpt files inside the <lines> tag (which contains <line> tags).
type |
See under the main options. |
dashtype |
See under the main options. |
linewidth |
See under the main options. |
linecolor |
See under the main options. |
pointtype |
See under the main options. |
pointsize |
See under the main options. |
fillstyle |
See under the main options. |
y2 |
Set y2 to indicate the you want the series shown at the y2 axis (right-hand y axis). |
Example using PLOT options versus gpt file
For instance, you may produce a graph with dashed lines using this:
time 2010 2019; x2 = x1 + 5; x3 = x1 + 10; x4 = x1 + 15; |
Here, in the main option field, the linetype is stated (type=lines), including the linecolor (color='blue'). These can also be stated individually in the elements options, if needed. In the element options, four dashtypes are given, for instance dashtype='1'.
Instead of the above PLOT statement, you may use:
plot x1, x2, x3, x4 using=p; |
together with the following .gpt file (xml):
<gekkoplot> |
As you can see, the structure in the first PLOT statement corresponds to the structure of the .gpt file. You may also combine PLOT options and .gpt files: in that case, the PLOT options will override the .gpt options. So for instance, plot x1, x2, x3<linecolor='red'>, x4 using=p; would make the third line red instead of blue.
Other examples
The statement
time 2010 2019; x2 = x1 + 5; |
plots percentage growth of the timeseries x1 and x2.
//..continued |
This creates two graphs that are put into two different .svg files. You may 'piggyback' gnuplot code along with the PLOT statement, for instance:
//..continued plot <plotcode = 'set xtics rotate by 90'> x1, x2; |
This rotates the x-tic labels. If you need to state several gnuplot statements, you can separate them with ;.
Age profiles
A special kind of plot shows the population of part of the population in age groups. If the annual array-series p!a is defined for different age-groups, for instance p[30] for 30-year olds, this array-series can be transformed via the rotate() function into another array-series p!u defined over the special 'undated' (u) frequency (now defined for different years like p!u[2020]).
p = series(1); //definition of p!a |
This produces the following plot, with the age dimension on the x-axis.

Plot file editor
Gekko uses xml files to store the plot settings. To edit these file, an in-built XML Notepad editor is available, cf. the XEDIT statement (if used, choose 'View' --> 'Expand All' to unfold all XML nodes). You may also use Notepad (cf. the EDIT statement), but it is recommended to use a specific XML editor for editing the tables. Using a simple text editor like Notepad entails some potential problems; there will be no check that the XML syntax is correct. Also, the XML syntax represents some characters in a special way: notably the < , >, and & characters (these should be written <, >, and &).
If the file is not in valid XML syntax, Gekko will complain that the file is invalid and abort.
Notes
You may close the PLOT graph window by pressing the [Esc] button. Besides, to quickly close all PLOT windows, you may alternatively use the CUT statement or the "Close all plot/decomp/trace/flowgraph windows" button.
PLOT can create a .svg, .emf, .png or .pdf file silently, if the file= option is used. The .emf files are practical for MS Office applications, including Word, but .svg is more modern and looks better on Office, too -- however drag&drop, copy/paste etc. with .svg files does not work as seamlessly for .svg files as .emf files. The .svg format is practical for html pages, and should usually be preferred over .png for such pages. PLOT uses the free open-source gnuplot 6.0 internally, and the options of the PLOT statement and corresponding .gpt file are named to match gnuplot naming conventions. Gnuplot supports many output file formats (so-called 'terminals'), so more formats may be added if needed.
When plotting variables, a !Search yellow warning sticker may be shown on the plot. When a variable does not have an explicit databank indicated like for instance b:x, and when databank searching is active (option databank search = yes), Gekko will search for the variable in the numbered databanks (numbers 1, 2, 3, and so on, cf. the F2 databank list window). When searching, and when a variable is found in position 2 or lower in the databank list, the yellow warning sticker is shown. This warning intends to guard against the presence of unexpected variable "holes" in the first-position databank. (The warning will never be shown regarding 'Ref' type plots, because in that case, variables are always taken from the databank in the 'REF' position in the F2 databank list).
Per default, PLOT will place annual and undated data at the x-tics, and quarterly and monthly data between x-tics. See option plot xlabels ... options, also if you prefer to use 15, 16, 17 etc., instead of 2015, 2016, 2017, etc.
Please note that the same graph may look different in different "environments". The Gekko graph window shows a .svg file, and the same .svg file may look a bit different when imported into Word (or converted to pdf or printed from Word). Both .svg, .emf and .pdf are vector formats, whereas .png is a raster format (bitmap).
Aspect ratio: if you want to change the aspect ratio (for instance into 16:10 or something else) of a file produced by plot ... file=..., the best way is to try to tamper with the size options: option plot emf size, option plot pdf size, option plot png size, option plot svg size. You may also try for instance the gnuplot code set size ratio ..., for instance plot <plotcode='set size ratio 0.625'>x; for 16:10 proportions, but beware that this also sets the aspect ratio in the Gekko PLOT window itself (this does not seem to work too well regarding the graph legend).
Related options
option freq = a;
option missing = error;
option plot all dash order = 1;
option plot decimalseparator = period;
option plot elements max = 200;
option plot emf size = '';
option plot lines points = yes;
option plot palette = gekko;
option plot pdf size = '';
option plot png scale = 3.0;
option plot png size = '';
option plot svg size = '';
option plot using = '';
option plot xlabels annual = at;
option plot xlabels digits = 4;
option plot xlabels nonannual = between;
option plot zoom dpiscale = 0;
option print index date = 'start';
option print index value = 100;
rotate()
Related statements
CLIP, CUT, DISP, MULPRT, PRT, SHEET