|
<< Click to Display Table of Contents >> Frequency and time period |
  
|
|
<< Click to Display Table of Contents >> Frequency and time period |
|
When working with timeseries, setting the global frequency and the global time period is usually the first thing to do. When Gekko starts up, the default frequency is annual (a), and the time period is set from t-10 to t, where t is the current year.
The frequency and time period settings control a wide range of statements, for instance creation of new timeseries, databank search, transformations, estimation, printing, etc. It is recommended to keep an eye on how the frequency and time period is set, and to aid this, the current frequency and time period are displayed in the lower left corner of the main Gekko screen:
You may change the global time period with TIME:
reset; time 2010 2020; |
The time period includes both the starting and ending period. You may use scalars like %t instead of fixed dates, to control time settings more dynamically.
With option freq ... ;, the global frequency can be set:
reset; option freq q; |
This shows the use of quarterly (q) or daily (d) frequency. In both cases, you may alternatively use time 2020 2020;, and Gekko will transform this into the same time periods with 4 or 366 observations, respectively. (In general, Gekko tries it best to translate 'foreign' frequency dates into current frequencies).
There are the following frequencies available in Gekko:
Name |
Frequency |
Example |
Periods |
a |
Annual |
time 2020 2022; |
3 |
q |
Quarterly |
time 2020q1 2022q4; |
12 |
m |
Monthly |
time 2020m1 2022m12; |
36 |
w |
Weekly |
time 2020w1 2022w52; |
157 |
d |
Daily |
time 2020m1d1 2022m12d31; |
1096 |
u |
Undated |
time 0 100; |
101 |
Undated frequency can be used to create, for instance, a timeseries defined over different ages, so that x[30] corresponds to 30-year olds, etc. It could also represent hours measured from some starting point, or any other repetitive data. Note that week numbering follows the ISO 8601 standard. This means that weeks around New Year are basically "strange" in the sense that the last days of particular year may belong to the first week of the subsequent year, and the first days of a particular year may belong to the last week of the preceding year (week number 52 or 53: the total number of weeks varies from year to year).
The COLLAPSE statement is used to convert a higher frequency time series into a lower frequency timeseries. If, for example, you only have quarterly data for a series y, it can be converted into a corresponding annual series by taking the average over quarters:
reset; |
Result:
y % y!a % |
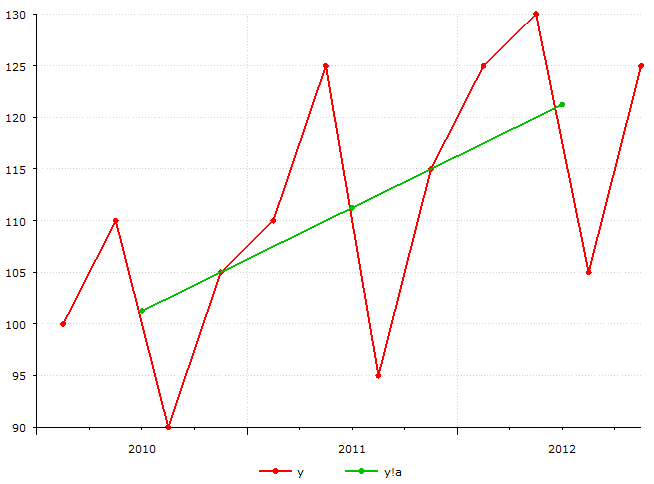
Here, we note the frequency symbol !, which is used to distinguish the annual series y!a from the corresponding quarterly series y!q. In general, if the global frequency is for instance quarterly, you do not need to decorate/suffix every quarterly timeseries y!q with !q , but can just use y, where Gekko implicitly adds the !q behind the scenes. The frequency indicators are mostly used when mixing frequencies.
As arguments to the COLLAPSE statement, you can choose between total, avg, first, or last. When using total, you get the sum of the observations, with avg the average, while first and last use the first and last observation, respectively. Gekko also supports auto-collapse when printing, for instance prt <collapse=avg> y!q; (this will print yearly averages).
If the global period is not undated, and if you use an integer sufficiently small, Gekko adds 1900 to the year. This means, for example, that 95 becomes 1995, and 125 becomes 2025 (the latter variant is less used, but time 80 2020; instead of time 1980 2020; can be practical enough).
Date scalars
In many contexts it is practical to use pre-defined date variables to set the different time periods. Scalar variables are often used for this purpose, that is, values, dates and strings (cf. also the user guide section on scalars). Such variables are often used for settings, for instance path strings that determine the location of different databanks, or date scalars that set different time periods. This is especially practical in large Gekko program systems, where the statements, for example calculations and updates etc. are unchanged, but where the desired period over which the calculations are to be made changes.
Gekko scalars (strings, values, and dates) must start with the symbol %, for instance:
reset; |
Such settings variables may be used in many places in subsequent Gekko program files in a larger data management system. When new data arrives, these settings may change, for instance changing the three date variables to 2013, 2016, and 2021. The location of the databanks may also change, for instance during testing. And a variable like %factor might be set to 1e6 instead, so that printing is done per million rather per thousand. To inspect such scalar variables, the MEM statement is practical, because it shows all scalar variables in all open databanks.
As mentioned in the user guide section on databanks, it can be convenient to place such settings variables in the Global databank, because this databank survives both READ, CLOSE *, CLEAR and CLOSEALL statements. The Global databank is always open, so you can just prefix global: on the settings, for instance global:%per0 = 2012; (cf. also the GLOBAL statement).
It should be noted that for instance %per0 in the example above is not really a date, but an (integer) value. In practice, this is not an issue, because %per0 can be used as a date in all relevant statements and functions. If you really wanted a date, you could indicate the type with date %per0 = 2012;, or use %per0 = 2012a; but there is not really any advantage of doing this. Dates can be stated in any frequency, for instance %per0 = 2012q2; or %per0 = 2012m4d1;.
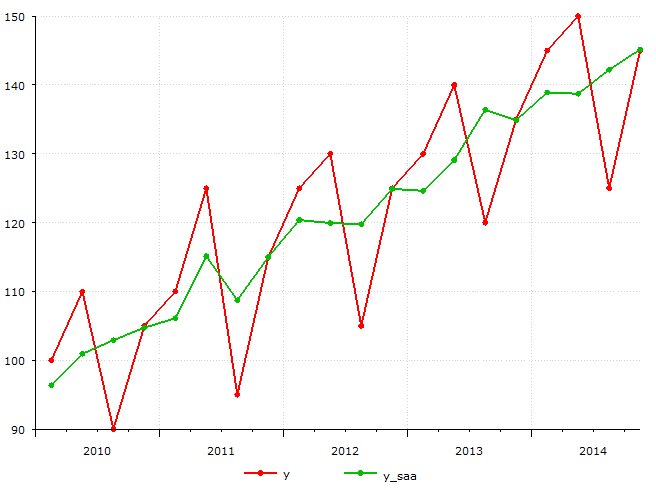
Seasonal adjustment
When working with monthly or quarterly data, there are often systematic fluctuations, recurring depending on the month or quarter. It is often necessary to correct for these seasonal fluctuations. In Gekko, the X12A statement is used for seasonal correction.
If you have a quarterly series y that needs to be seasonally adjusted, you can write:
reset; |
Result:
You may fine-tune the X12A statement with special parameters, cf. the statement description.
Structural levels
When working with monthly, quarterly or annual data, one is sometimes interested in finding the structural levels. One way to find the structural level of a series is by using a Hodrick–Prescott filter (HP filter), which inputs an economical time series y[t], it adjusts a trend g[t] by solving a minimization problem.
The syntax for using a HP filter in Gekko is for instance:
reset; |
Result:
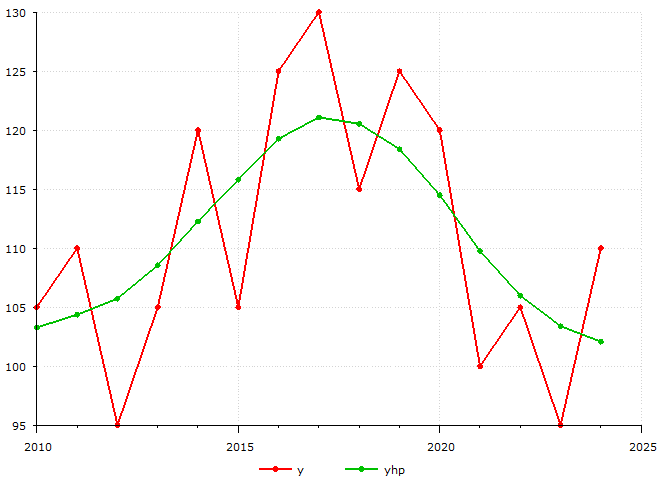
The statement returns a trend-adjusted variable yhp of the variable y. Lambda is usually set to 6.25 for annual series, 1600 for quarterly series, and 129600 for monthly series. Usually one finds the structural level of seasonally adjusted variables, so in our case the following: yhp = hpfilter(y, 1600); Note that in general, you may move the first argument of a function out of the function like this: y.hpfilter(1600), instead of hpfilter(y, 1600). This often allows a more "fluent" syntax, and allows chaining like for instance y.hpfilter(1600).avgt() for taking the average, instead of the more backwards avgt(hpfilter(y, 1600)).
Interpolation
Gekko has an INTERPOLATE command that does the inverse of COLLAPSE, that is, INTERPOLATE transforms (disaggregates) a lower-frequency timeseries into a higher-frequency timeseries. There are several methods regarding this, the most advanced being in the so-called Denton-Cholette family.